Project Gateway
PRODUCT VISION & STRATEGY
In 2021, Vungle (which would eventually rebrand to Liftoff) responded to Apple's privacy opt-in requirements with 4 strategic acquisitions, leading to fragmented user experiences and challenges in aligning a new combined company vision.
In my first 90 days, I was tasked by the CEO and Head of Product to craft a cohesive strategy on how these new acquired products could ultimately serve a single customer through a unified enterprise software experience, focusing on boosting recurring revenue and providing unique value in the mobile gaming market. This involved creating a north-star product concept and seeking buy-in from senior stakeholders across different newly acquired companies.
Mergers & Acquisitions
Oct 2020
•
Vungle acquires bid automation co Algolift
Mar 2021
•
Vungle acquires gaming intelligence co Gamerefinery
May 2020
•
Vungle acquires creative builder co Tresensa
Jul 2020
•
Vungle acquires influencer marketing co Jet Fuel
Oct 2021
•
Vungle merges with DSP co Liftoff
Oct 2022
•
Liftoff / Vungle rebrands to Liftoff
OVERVIEW
Unifying Fragmented Experiences:
Vungle's Acquisition Integration Journey
Market Context
Apple's new opt-in requirements for IDFA (also known as Unique Device ID) heralded a seismic shift in how performance advertisers could track and retarget potential customers on mobile devices, which represented well over 50% of internet traffic globally and was only climbing. This change threatened to significantly complicate ROI measurement on marketing budgets, introducing heightened risk for advertisers and potentially reducing reducing spend across the entire mobile ad ecosystem.
Business Context
In response, the mobile advertising industry experienced a surge in mergers, acquisitions, and overall market consolidation over the following years, with Vungle being no exception. In 2021, in a strategic move to diversify and strengthen its value and services for mobile app publishers, Vungle embarked on a rapid acquisition spree, purchasing four businesses within just eight months.
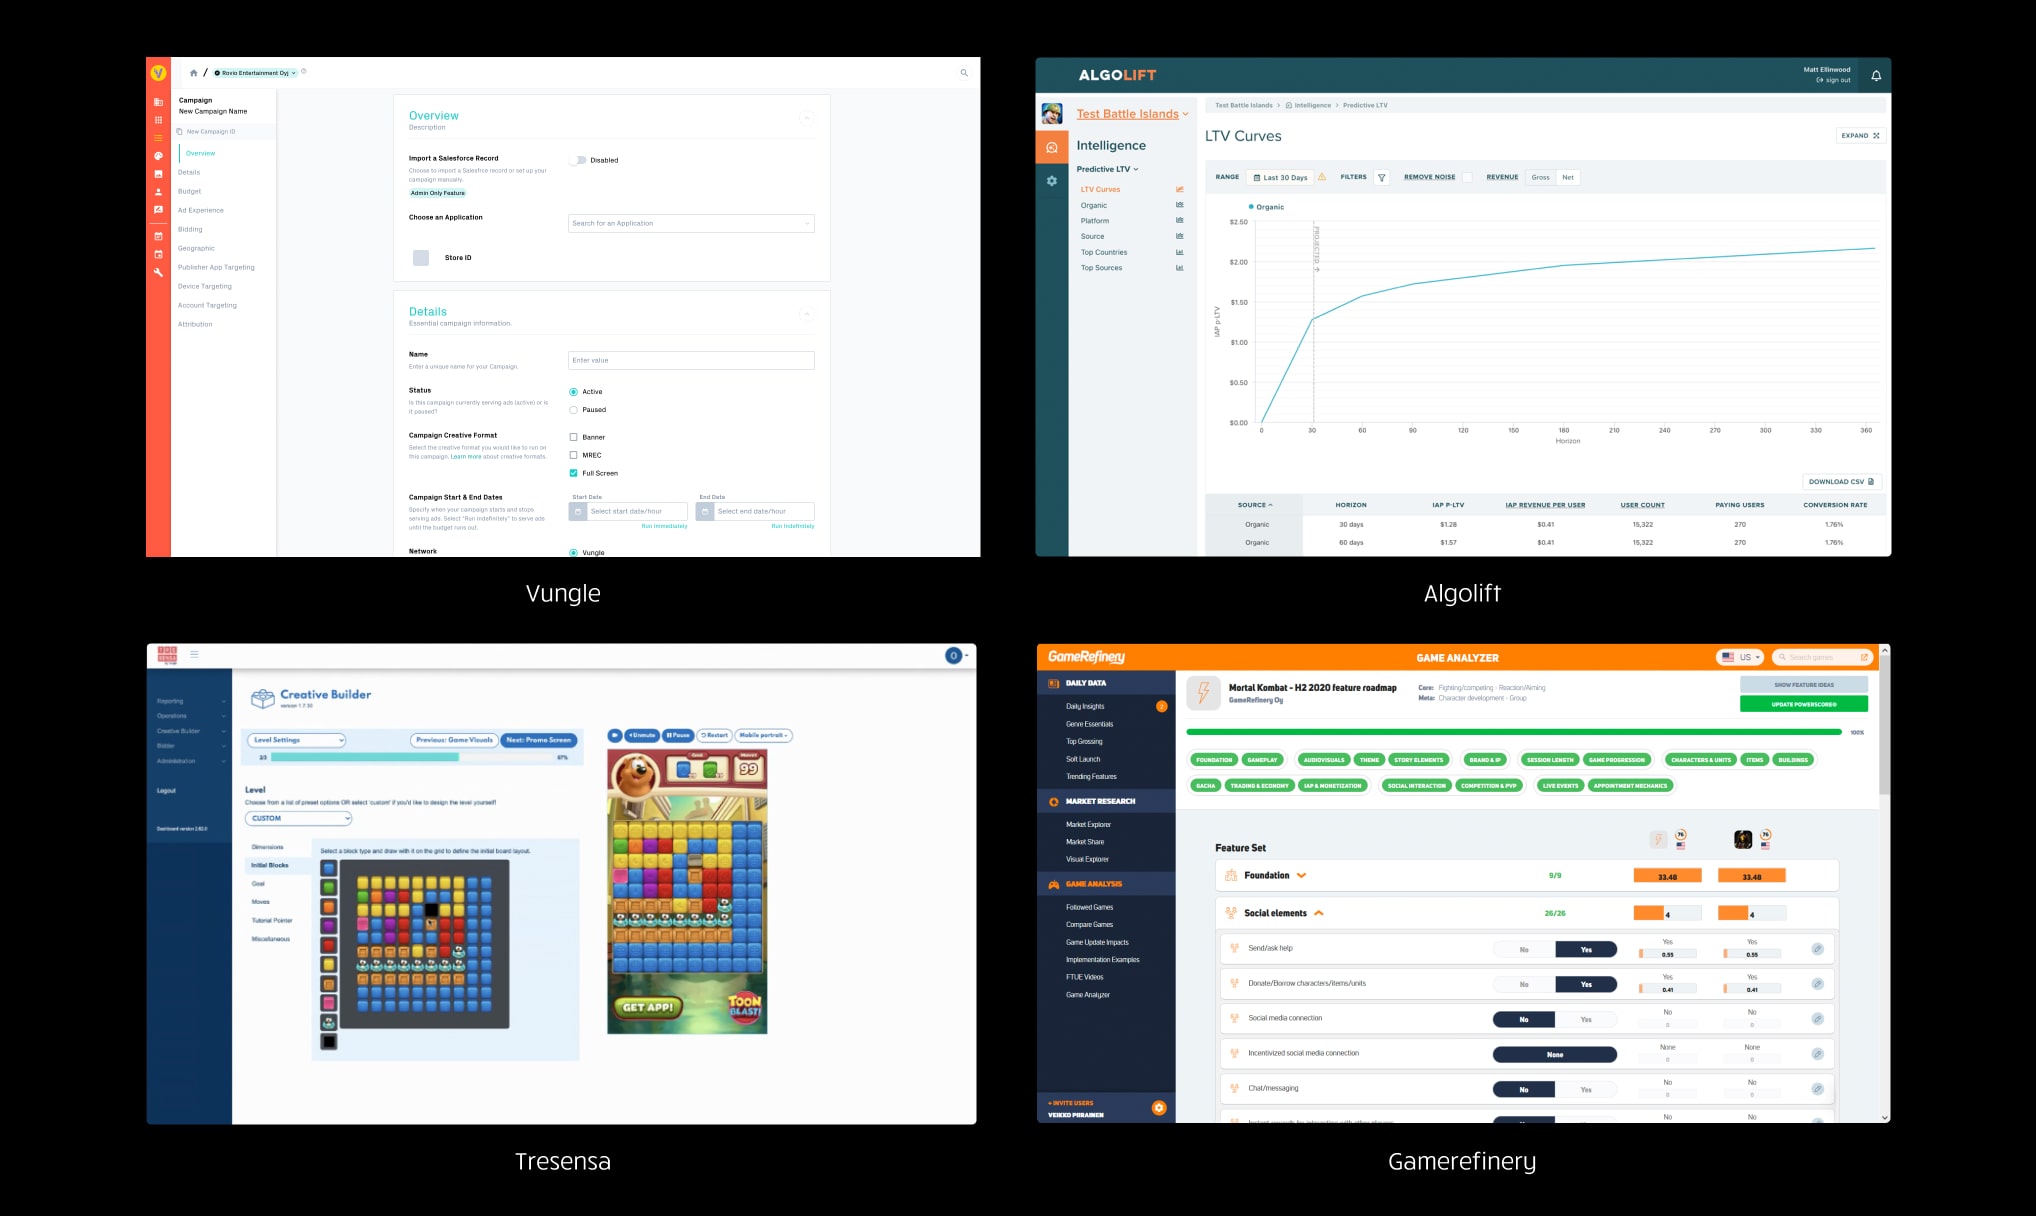
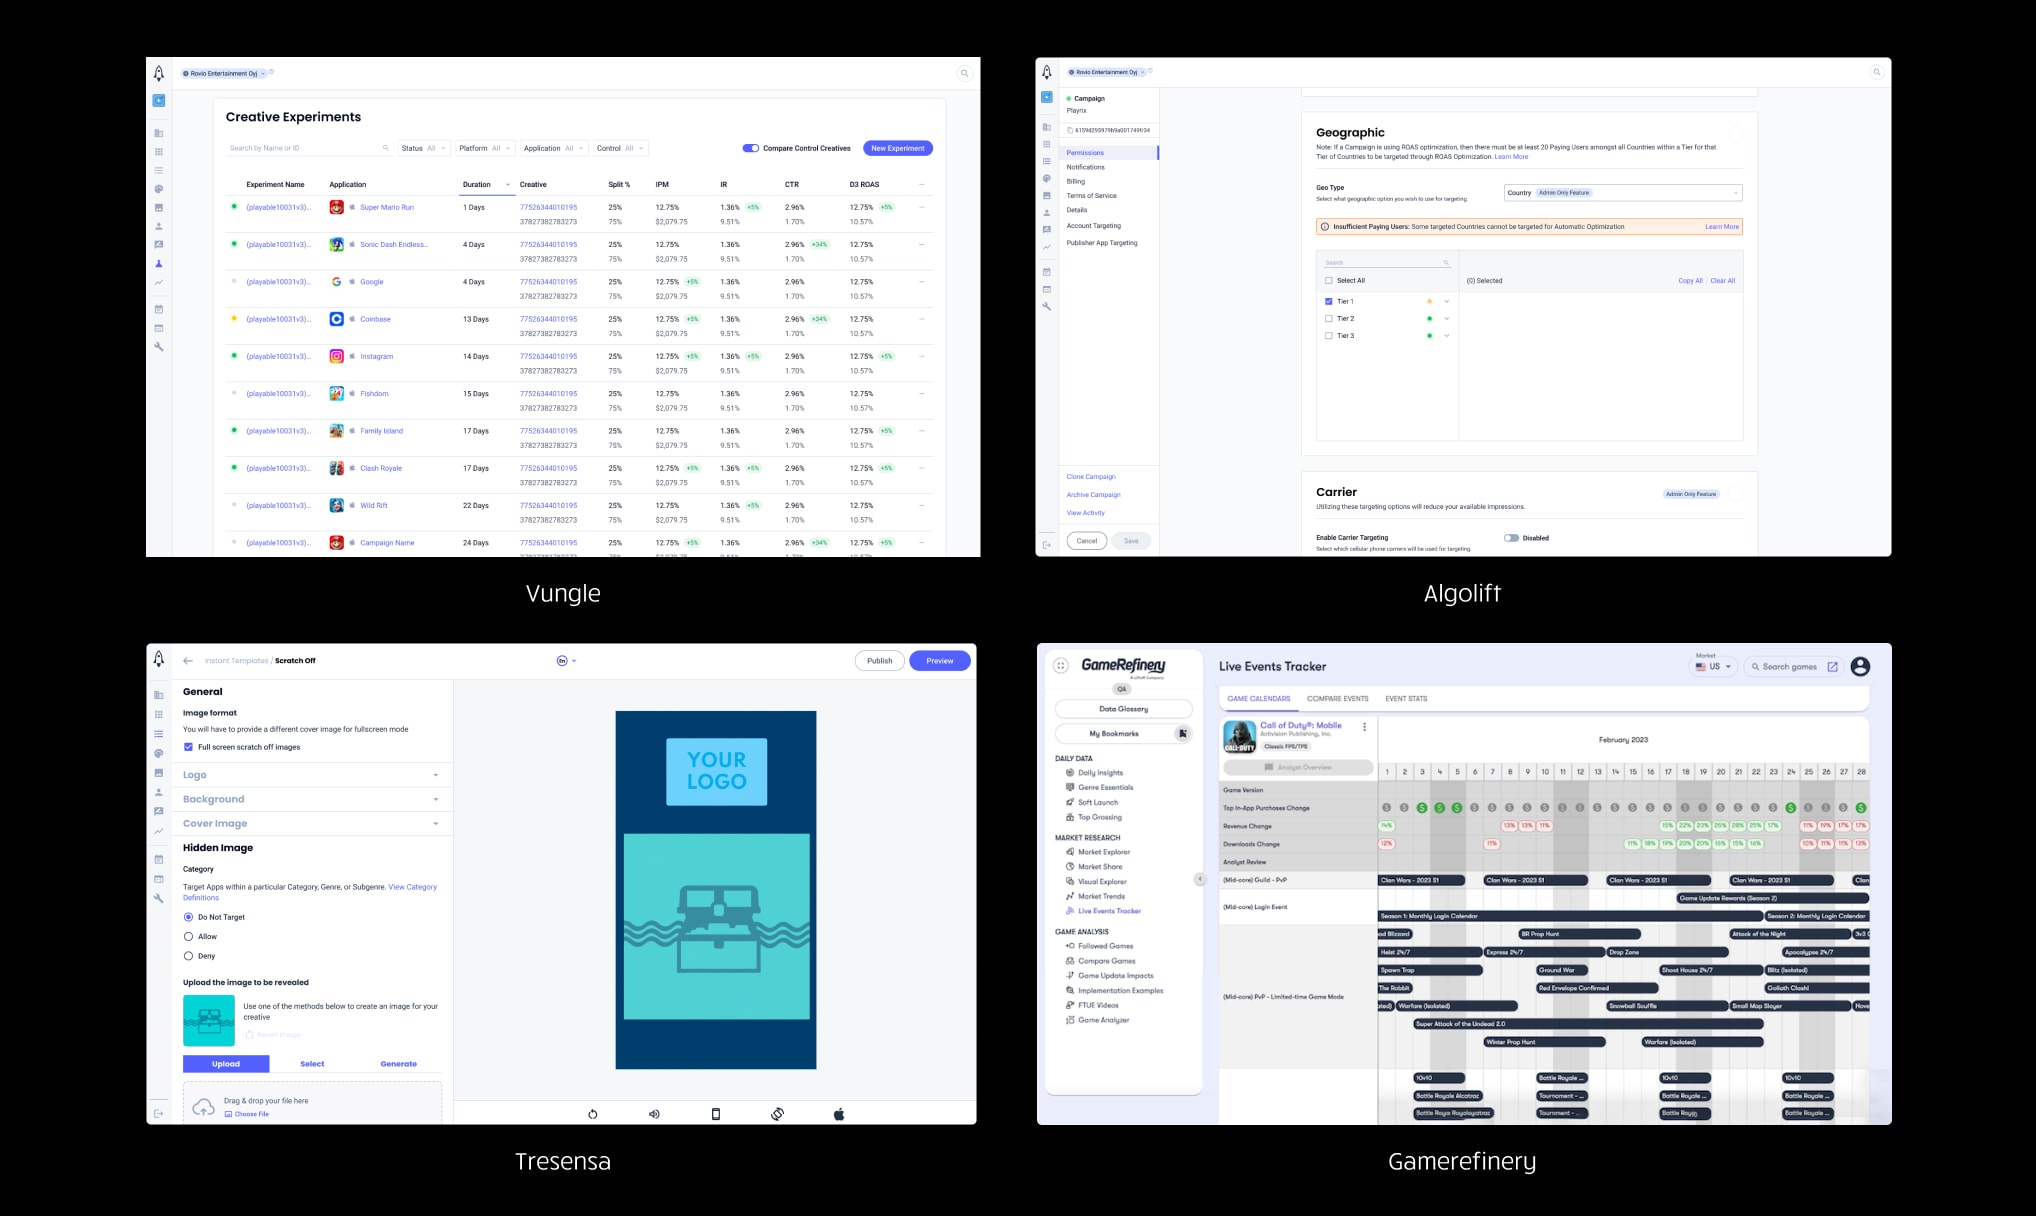
Acquired products coming together under a cohesive user experience
Challenges
- Acquisitions led to a fragmented user experience.
- Customers lacked an immediate exposure to new products and how they could benefit from those features and services.
- With the imminent loss of device IDs making it impossible to track users across multiple apps, advertisers instead of relying on user data, are scrambling to stay ahead of the competition, looking to leverage historical, creative data to drive engagement.
- Merged organizations had difficulty orienting around a shared vision of how the new combined Vungle business would position its unique value offering in a crowded and competitive mobile ad ecosystem.
Objectives
My task was to chart a path for integrating acquired products into our core business and fostering a unified enterprise software experience. I audited all products and rapidly iterated on possible user journeys and prototypes, seeking buy in from stakeholders across sales, operations, and product/tech. This integration sought to elevate recurring SaaS revenue and deliver differentiated value in a fiercely competitive mobile gaming marketplace.
Upon just joining the company, the CEO and Head of Product tasked me to think big and craft a cohesive vision within my first 90 days. This was a very ambitious first task to take on, but despite the challenge, I felt set up for success thanks to continuous support from Product Leadership. I additionally used my over a decade of experience in mobile ad tech to leverage my operational and customer relationships that I had built from working at AdColony and Opera Mediaworks, which had significant overlap with Vungle.
Outcomes
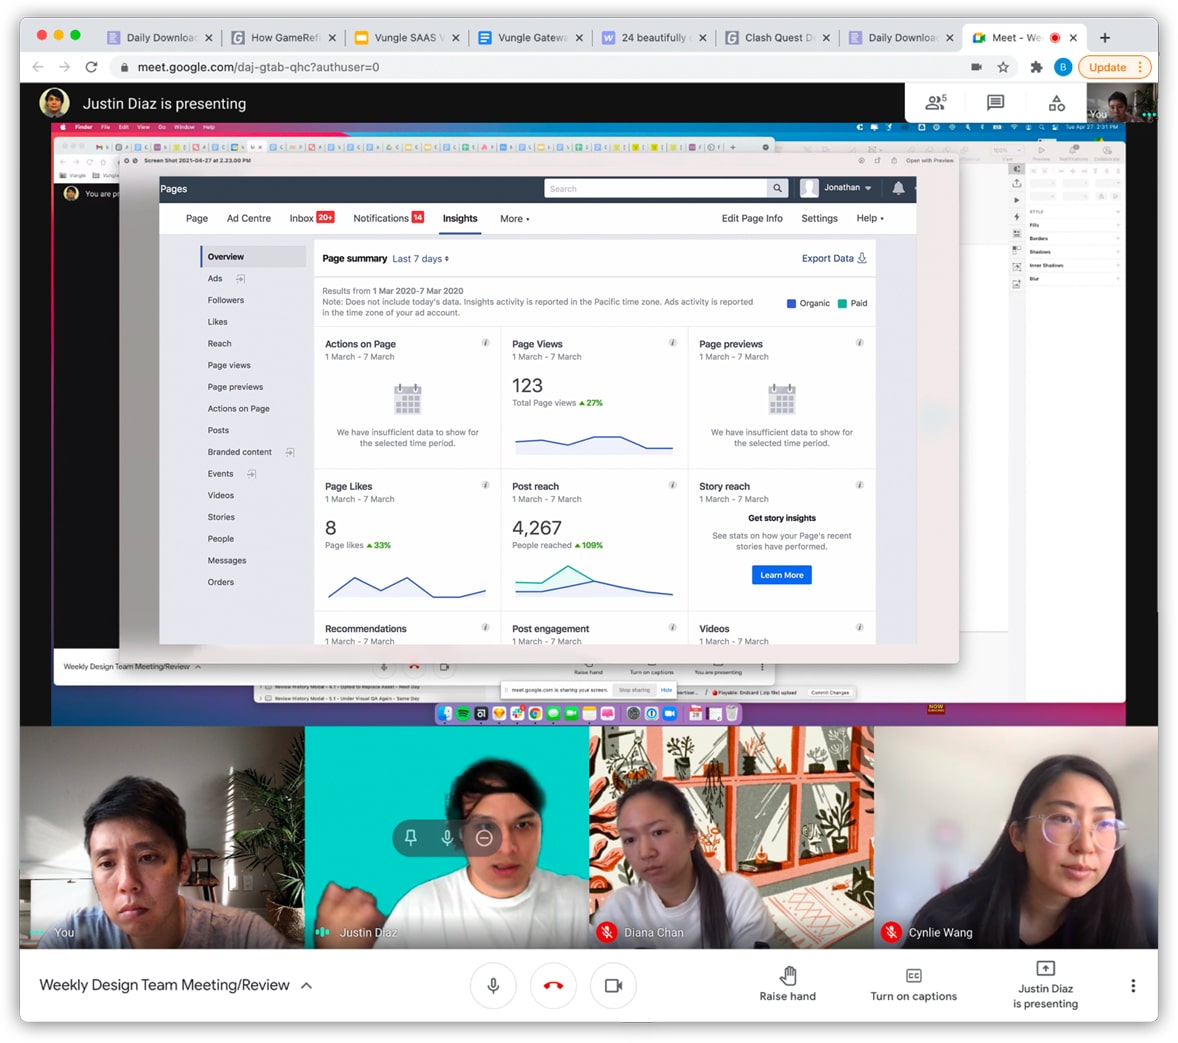
Crafted and delivered polished directional concepts and prototypes to the entire organization during multiple worldwide all-hands meetings within a tight 90-day timeframe. This effort aimed not only to secure broad organizational support but also to foster a shared vision among teams representing diverse cultures and fragmented missions across multiple distinct companies within a newly assembled Vungle ecosystem.
→ Watch my presentation of the unified vision presented to the whole organization.Continued to iterate on innovative, potentially first-to-market features around Creative Insights giving advertisers and creative strategists data visualization and reporting tools to understand creative trends at the macro and micro level. Iterated on designs using real data shared with real customers and creative strategists to help understand the most effective way to surface data insights on Video, Banner, and Playable Ads. These data visualizations went on to become an essential part of the discovery and customer review processes for the internal Creative Studio.
→ (Coming Soon) Watch a walkthrough of prototypes I developed to validate Creative Insights features to our top customers utilizing real data and use cases.- Led integration roadmap across multiple product development teams for the following 12 months.
• Cross promotional and workflow unification efforts contributed to a $10MM Exit ARR 6 months after the vision was annonuced.
• Visual rebrand and shared navigation was implemented out to all customer facing touchpoints owned by Product/Tech. Shared component design system was adopted by 50% of dev teams.
• Algolift machine learning ROAS integrated into Vungle core product and grew to represent 70+% of Ad Spend within 18 months accompanied by consistent QoQ growth for overall business unit.
• Gamerefinery Creative Intelligence went on to become an essential part of the discovery and customer review processes for projects carried out by the internal Creative Studio.
→ (Coming Soon) View a summary of outcomes shipped from the unified vision that released over the following 12 months.
To view a detailed look into my process, please continue reading below.
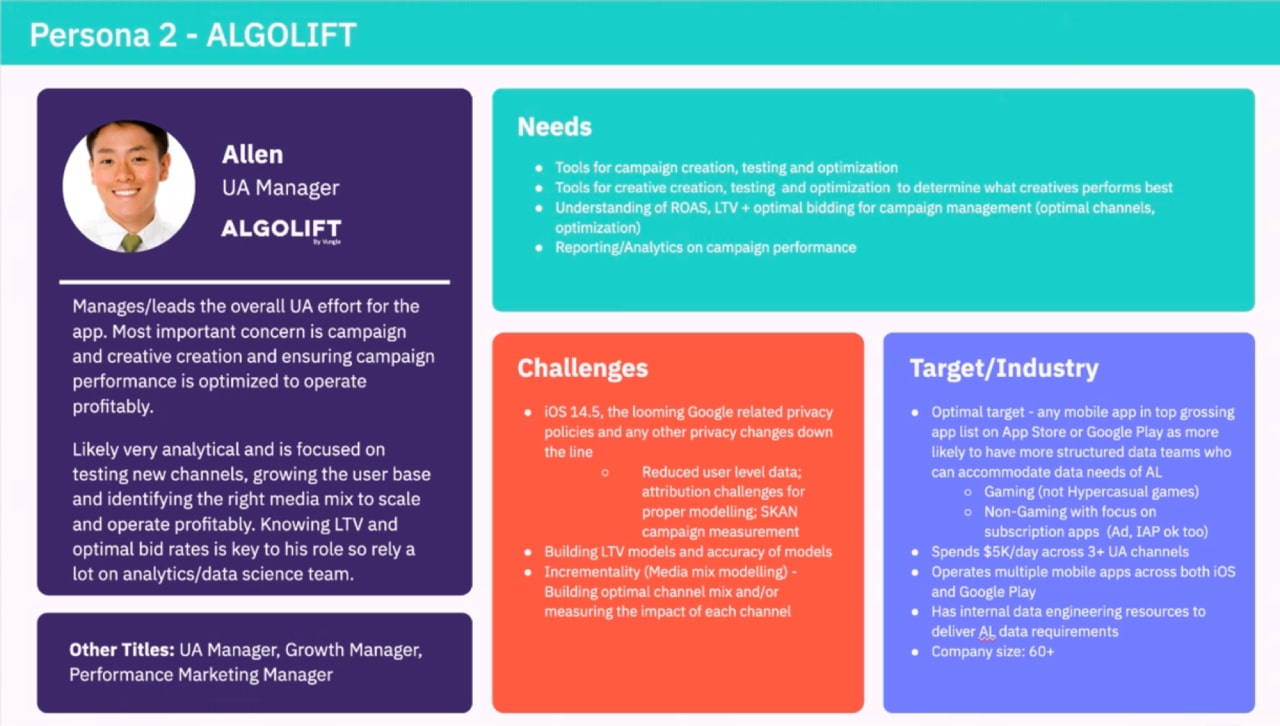
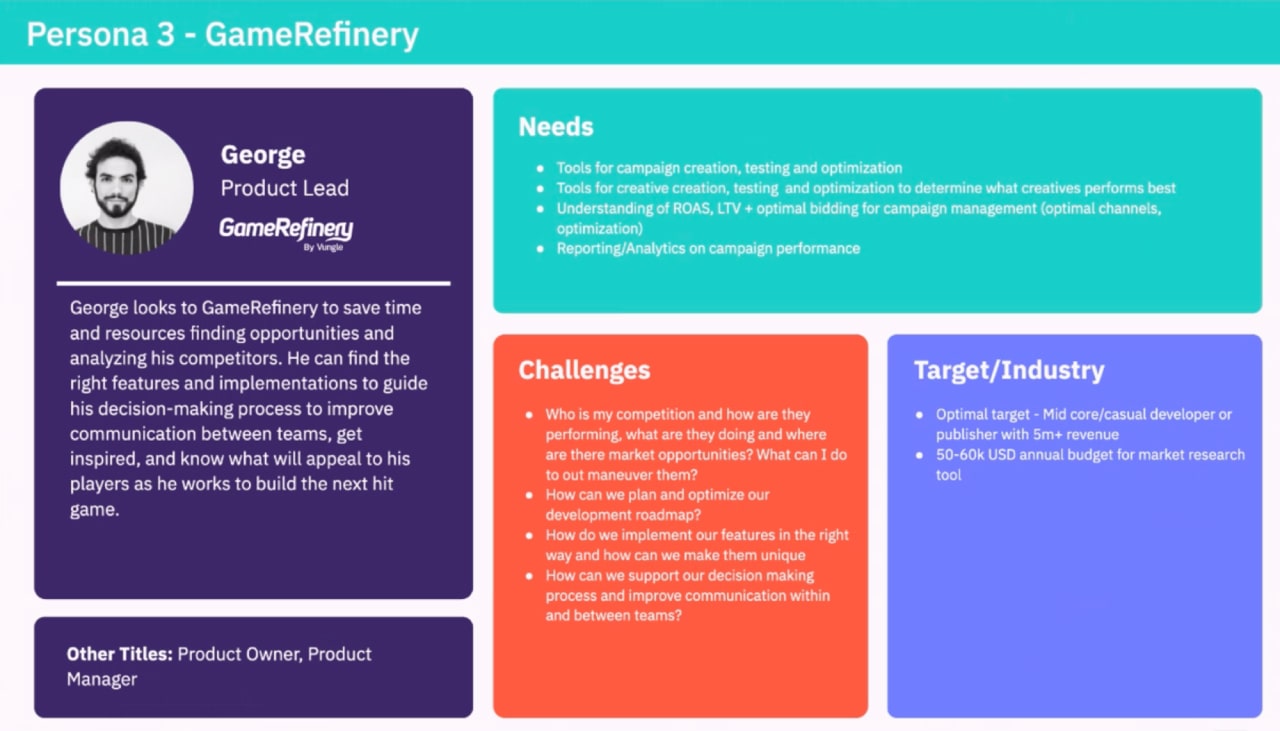
PART ONE: EVALUATION
Onboarding and understanding the current customer experience
Identifying key customer personas and journeys
I initiated discussions with founders and leaders across sales, creative operations, product, and engineering from the core Vungle business and all four acquired businesses, seeking insights into their product features, customer tendencies, and growth aspirations. This collaborative process involved gathering a group of senior contributors who shared genuine excitement and commitment to shaping a cohesive vision for the new company, many of whom were part of Vungle's internal Creative Studio. As I progressed through the exploration work for bringing together the aligned vision, Vungle acquired 2 more products, which expanded the scope of the vision.
Along with stakeholder interviews, I also analyzed as much user data as I could access from each of the products in order to get a pulse on user painpoints and UX deficiencies that would need addressing. The data sources were fragmented across several different tools like Google Analytics, Hotjar surveys, Fullstory session recordings, while some products didn't have any user analytics whatsoever. In those cases, assessing activation rates was done by querying signals from recently onboarded cohorts with the help of a data analyst (ie: measuring the funnel completion / churn rate at pre-defined checkpoints in the onboarding journey).
Framing the problem
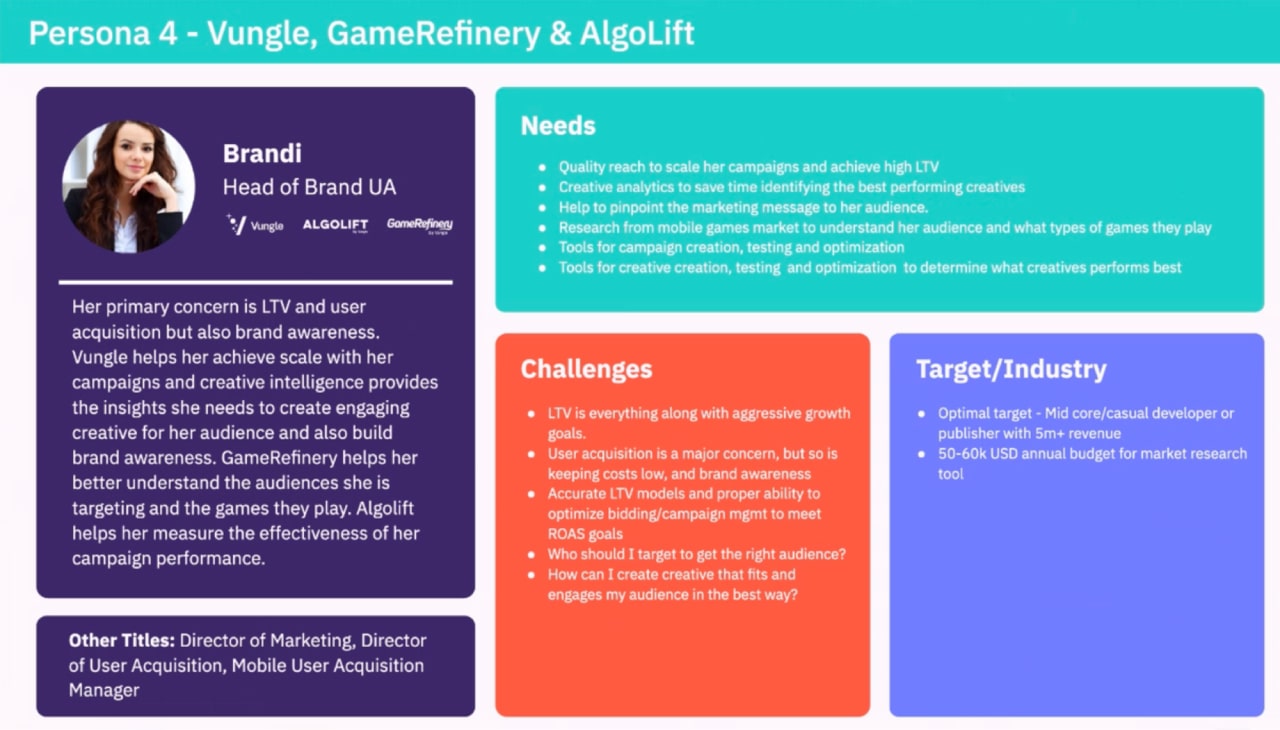
After onboarding and auditing each product, I put together a combined customer journey map for each of the products, which helped anchor conversations about how customers could benefit from multiple products. As a group we narrowed in on 4 major customer personas, that would benefit from one to many of Vungle products. While an individual mobile publisher could benefit the entire portfolio of products Vungle offered, it was extremely helpful to focus on the key customer personas that would benefit from each product.
I broke the customer journey into 3 sections, which helped frame how to approach distinct sections in the customer's experience with each product:
Acquisition: This phase involved the customer's interaction with the website, gated content, and email drip campaigns before signing up and/or paying for an annual subscription.
Activation: After a customer committed to using the product, a separate section was documented covering the onboarding experience, any automations in place, and known areas of improvement.
Retention: The last section covered the major task loops that customers experienced during a typical session with the product, focusing on enhancing user engagement and loyalty over time.
Auditing the competition
I partnered with the Vungle Ads dashboard PM to do an extensive audit of other ads dashboards that our customers used in addition to Vungle. We took note of some of the feature gaps between dashboards from the self-serve perspective.
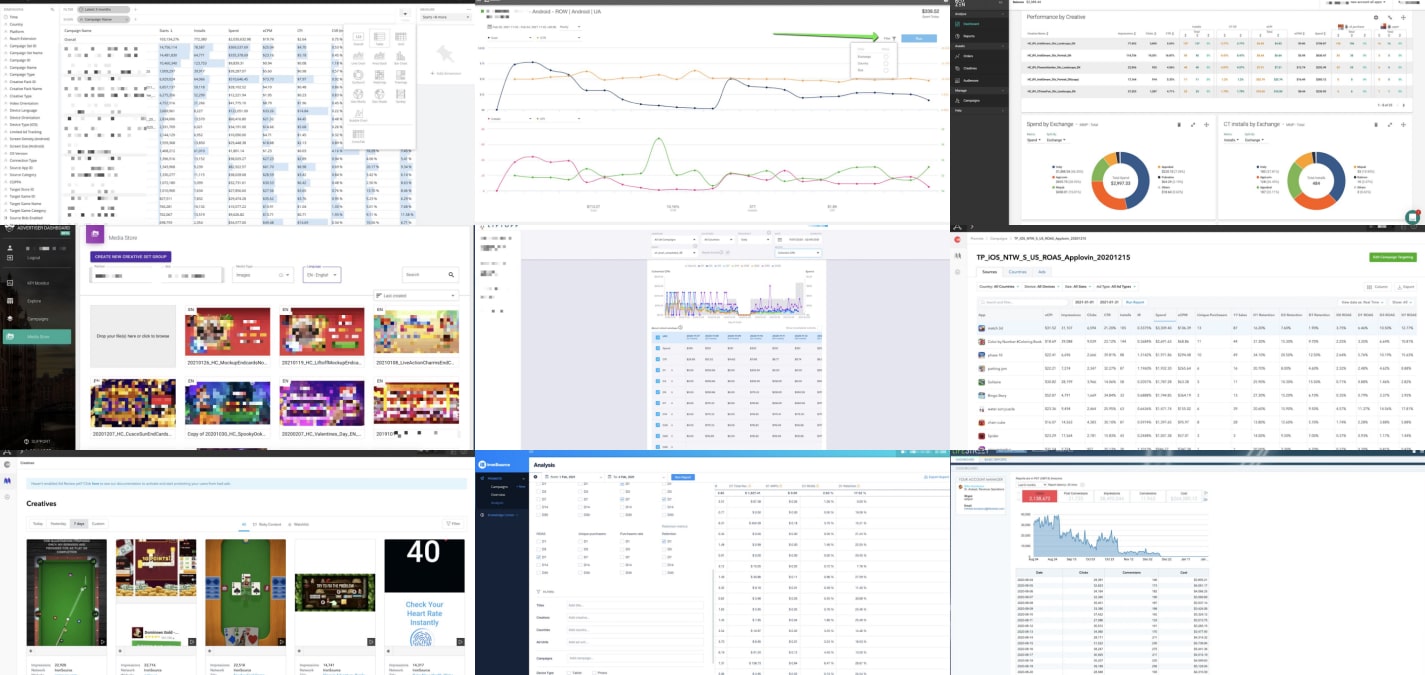
Auditing 15 different mobile ad and mediation self-serve dashboards that were known to be used by our top customers. In some cases we were able to tap some of our colleagues to show us their dashboards first hand so we could get a first hand look at these dashboards populated with real data, which helped us better understand each product's feature set and how they are used.
PART TWO: EXPLORATION
Gathering ideas from across the organization
Design Workshops
Of all the different teams across the Vungle organization, the Creative Studio team was the team most actively embracing the other products and incorporating them into their workflows. In particular they were using Gamerefinery to understand the different player motivations of games their ads would run in, and they were using the Gamerefinery Creative Intelligence tool to analyze creative attributes to find patterns amongst the top performing creatives across the Vungle network; in addition, they were using Tresensa to quickly create and iterate Playable ads based on ready made templates.
I organized a series of workshops with the Creatve Studio team and the Product Design team to learn from how the creative strategists were leveraging creative research from Gamerefinery and how that could be incorporated into the Vungle Ads dashboard to productize creative ideation discovery using the unique features from Gamerefinery and Vungle.
We ran a separate workshop as a Product Design team ideating on ways to level up the reporting experience in the Vungle dashboard to better showcase these creative insights and foster a better analytics experience.
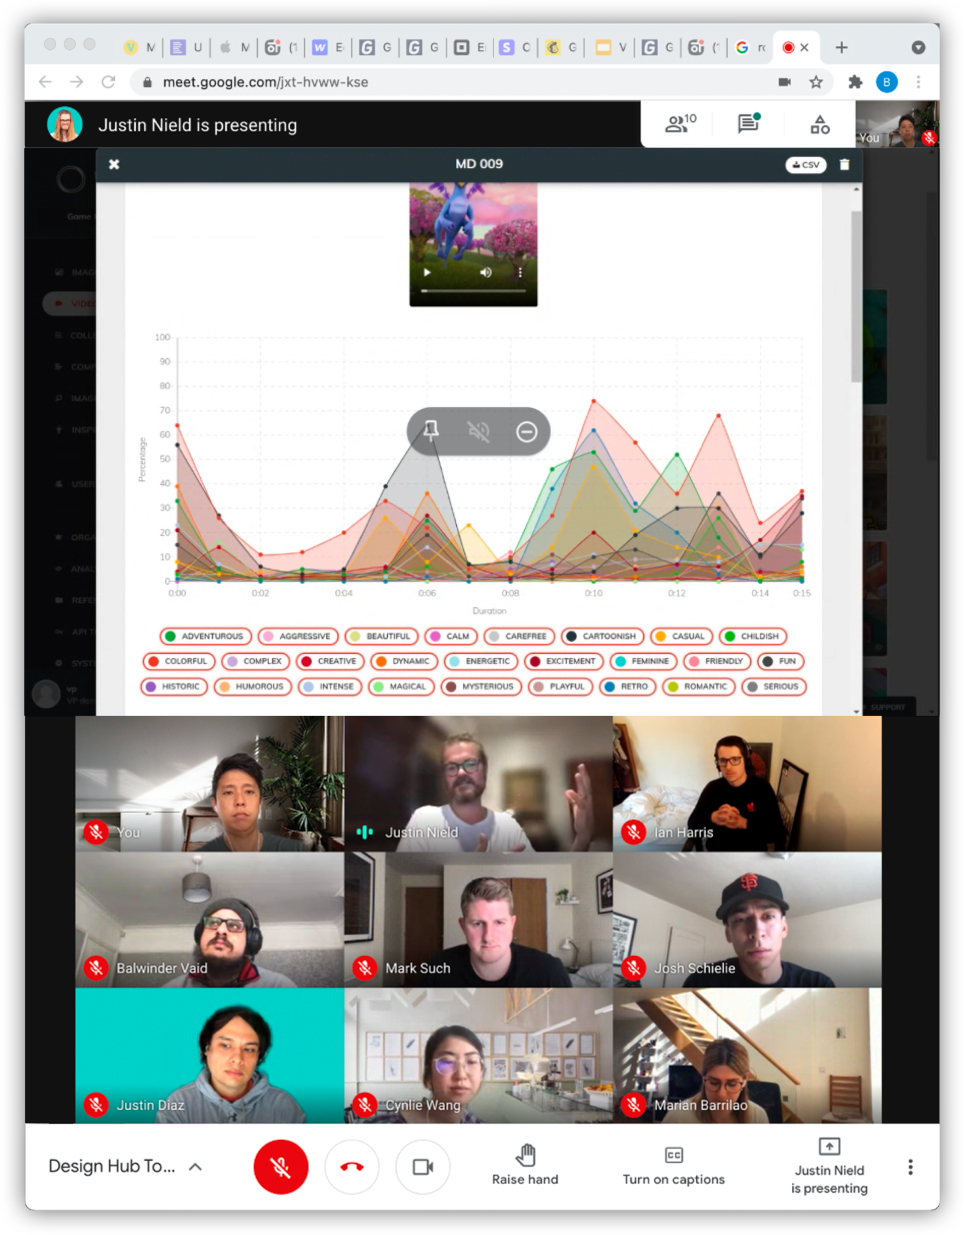
Creative Strategists sharing how they use creative data from Gamerefinery to inform their discovery process when creating new videos for customers.
Broader Product Design team sharing reporting UX inspiration as we ideate on how we might make the reporting / analytics experience more efficient and effective in the Vungle Ads dashboard.
Designing with transparency
Armed with a plethora of concepts and ideas, I stitched together a workflow of features and screens that would eventually become a high fidelity prototype. As I iterated on wireframes, flowcharts, and designs, I continuously refined the fidelity of the designs, eventually crafting a polished prototype to effectively communicate the full customer journey. Regular stakeholder syncs and design critiques provided opportunities to share progress and incorporate valuable feedback, enhancing the clarity and effectiveness of my message while ensuring stakeholders remained informed of our advancements.
I also posted regular screenshots or my progress in a dedicated channel on our company Slack so progress and transparency was as accessible as possible. This multi-channel communication method enabled me to advocate for our product area quickly and efficiently while maximizing transparency.
Consistently engaging with key stakeholders, both in group settings and one-on-one meetings, allowed me to assess potential customer receptiveness, gather feedback on design patterns, and identify potential challenges early on. This proactive approach prevented stagnation in the refinement process and ensured ongoing alignment with stakeholder expectations.
Over subsequent weeks, I engaged with over 50 individuals across the combined organization, actively listening and learning about each business's unique attributes. Over many iterative discussions and collaboration, I facilitated the refinement and convergence of a comprehensive set of user personas and user journeys that provided a foundational mental model and framework to guide the development of a shared vision and strategy among disparate products.

Wireframes that progressed in fidelity as I gathered more feedback and consensus around the product vision.
PROTOTYPE DEMONSTRATION
Turning a set of features into a story
At the company's July All Hands Meeting, I presented a high-fidelity conceptual prototype of how an advertiser could benefit from multiple products/services in the Vungle portfolio in a seamless user experience. The demo helped align everyone on a shared mission providing clarity on the value proposition and demonstrating how our customers could leverage the newly acquired products.
View a recording of the demo below:
Demo Highlights
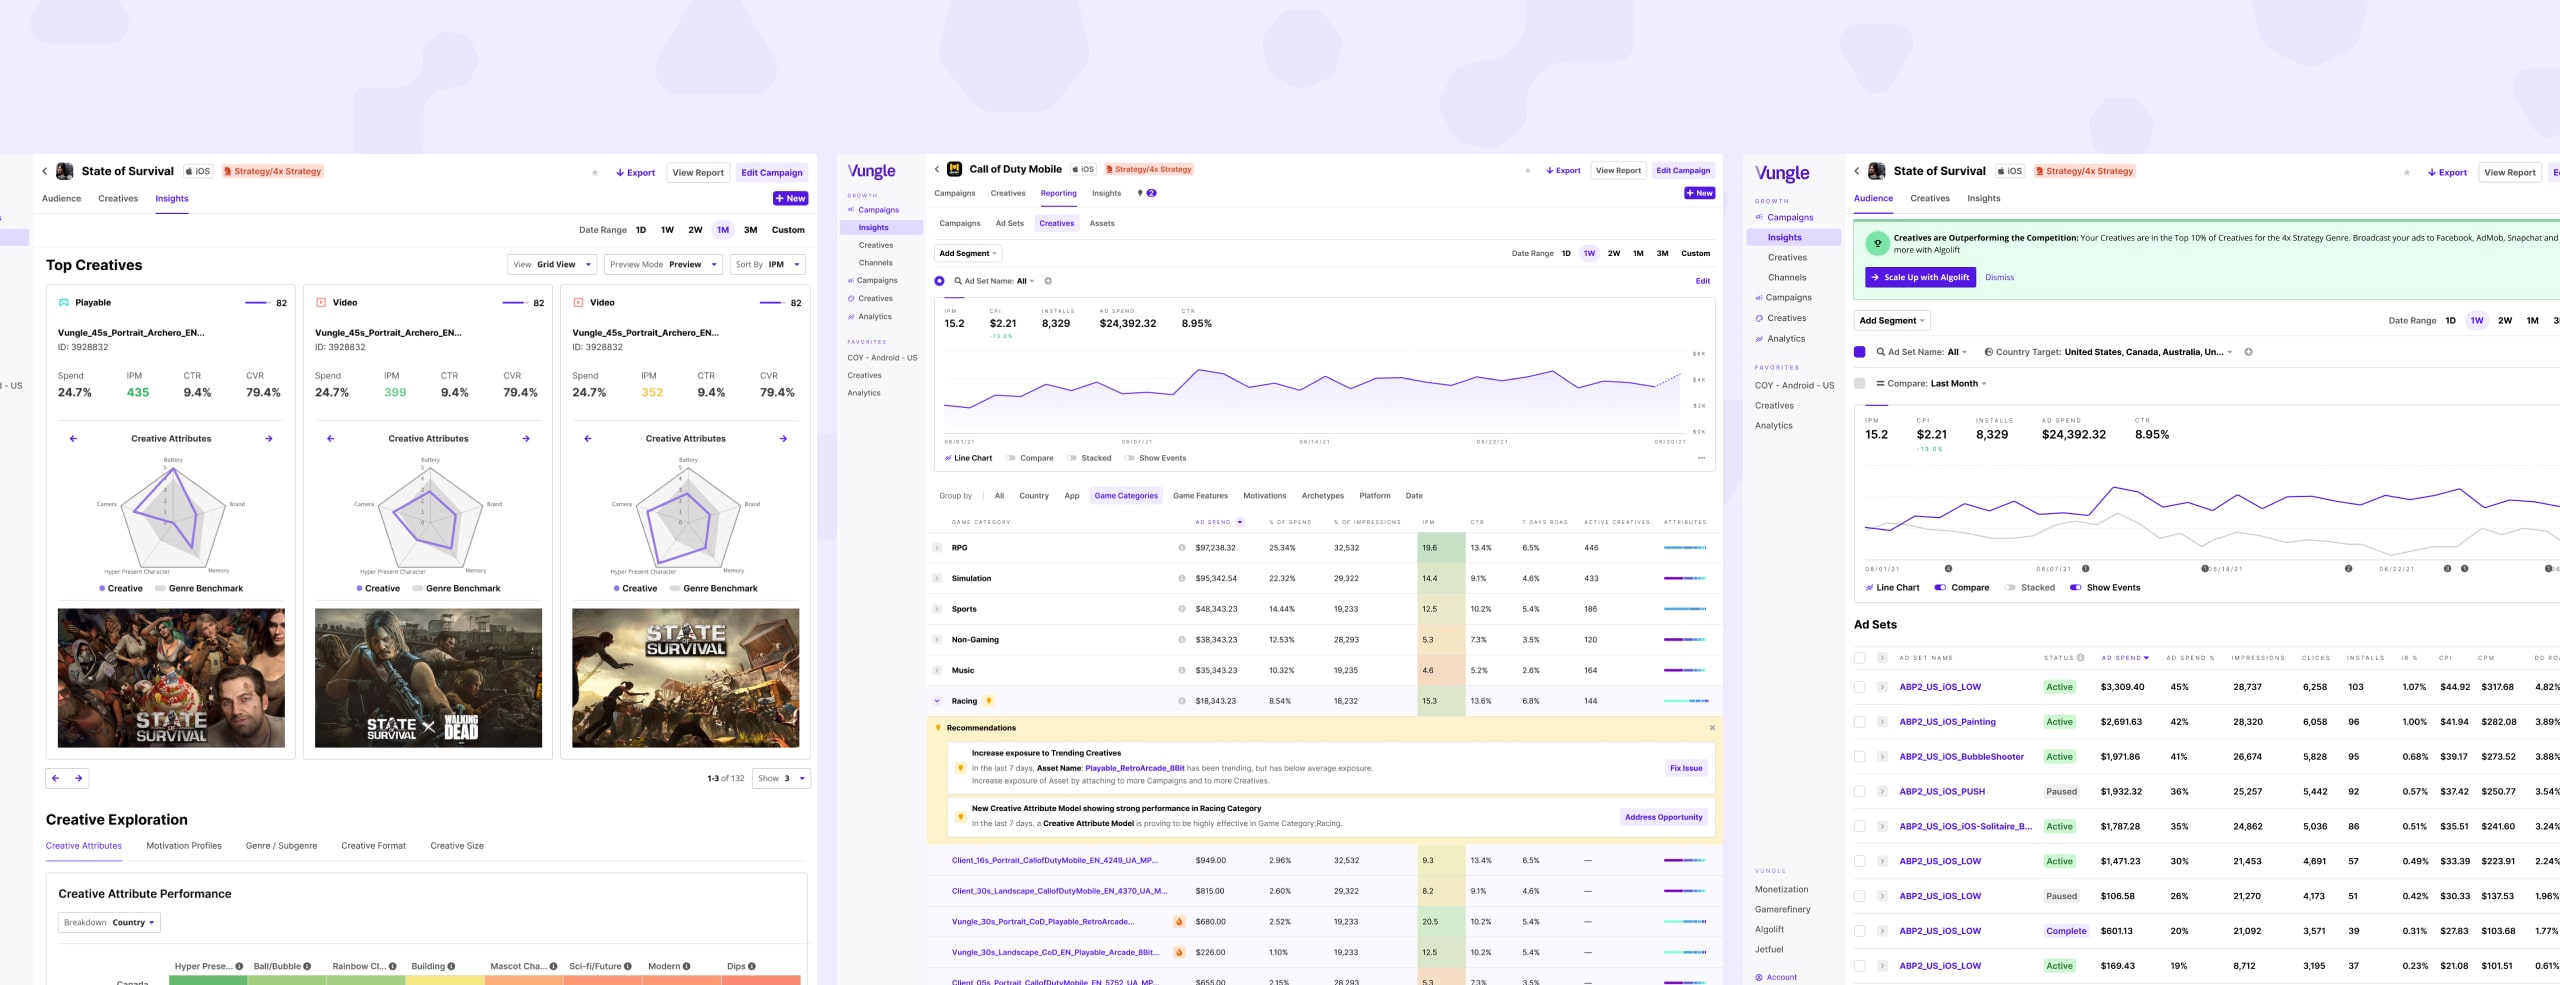
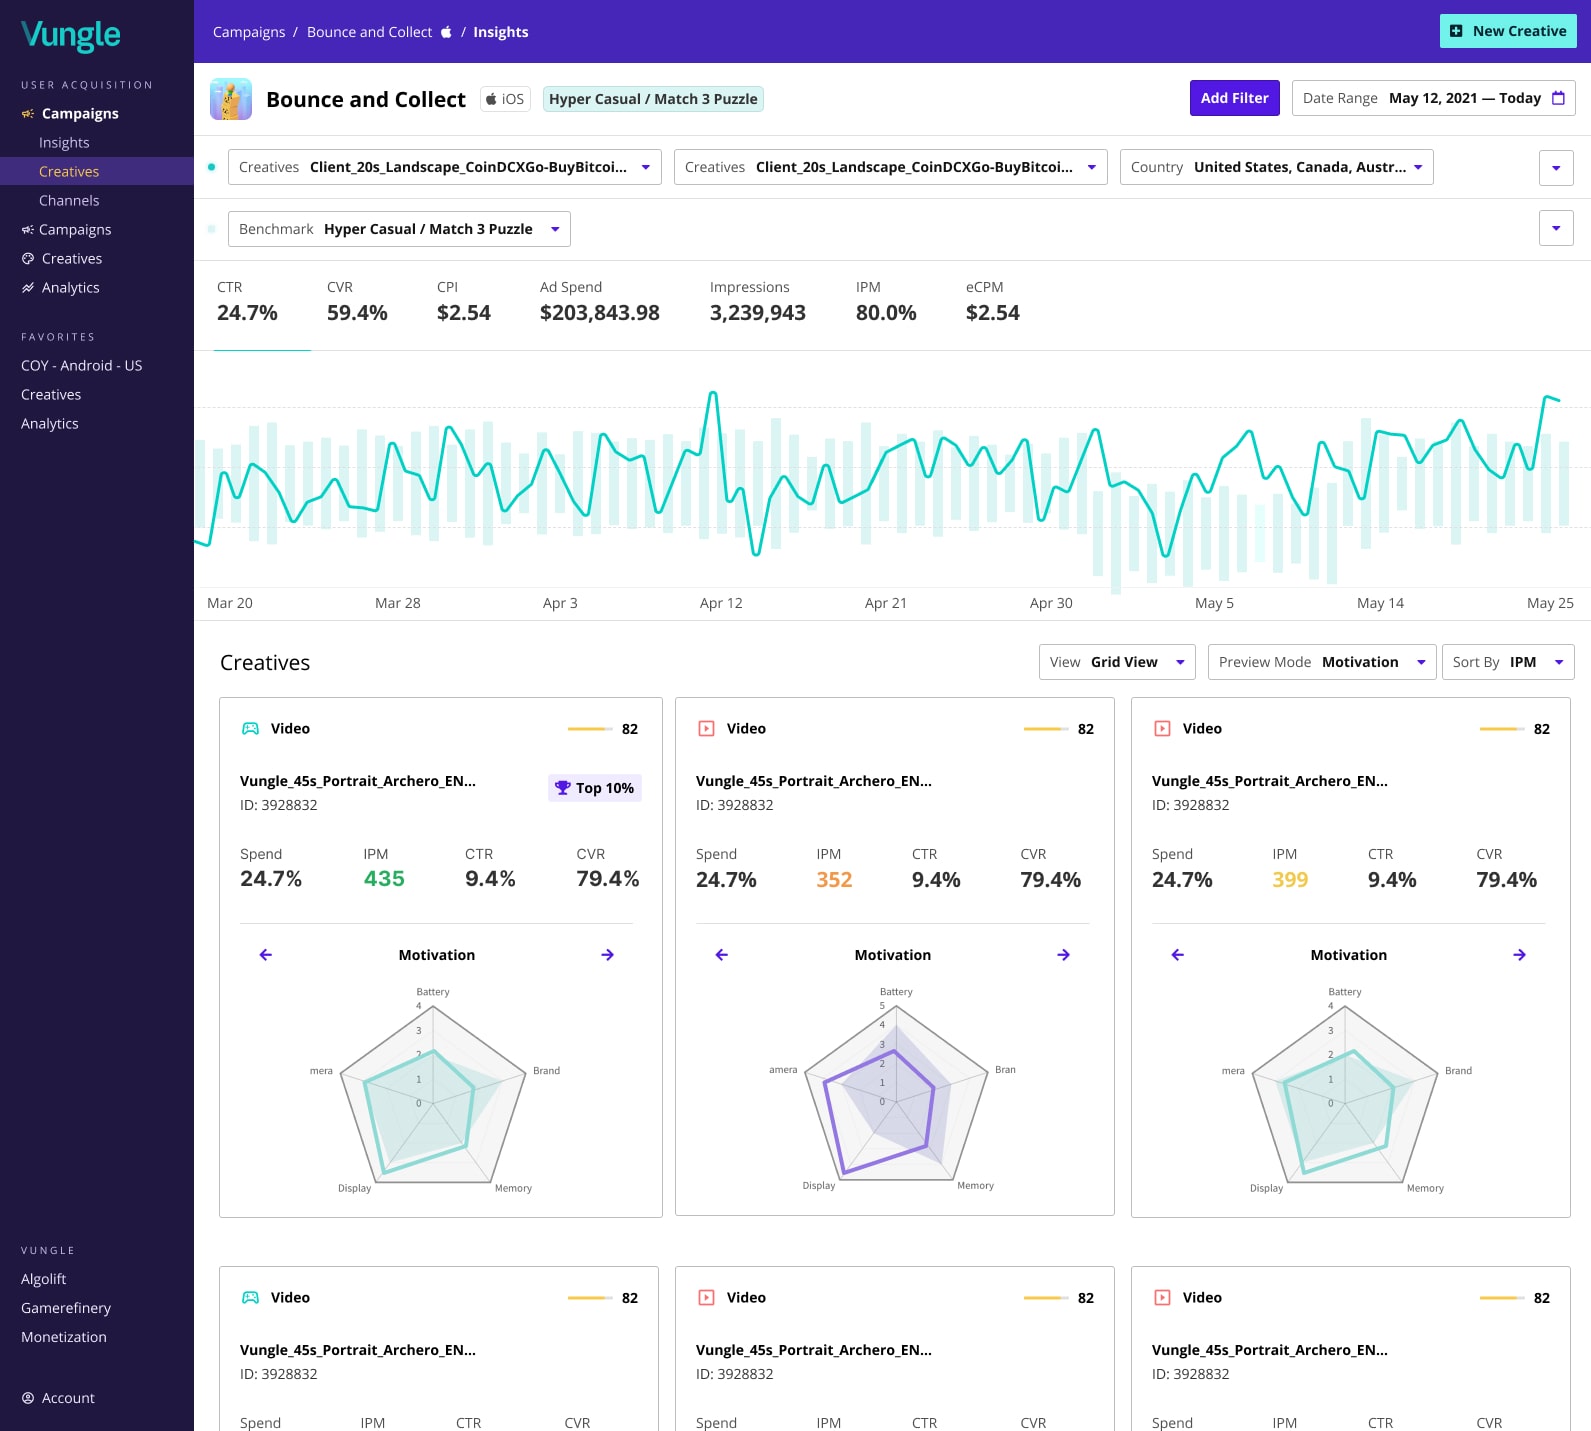
Understanding how different markets respond an ad
"How might we enable customers to quickly compare trends in data across multiple audience segments?"
How are different audience segments/demographics responding to my ads? Comparing Ad Performance (Installs per Mile) from Tier 1 vs Tier 3 countries. In this case we can see that overall the Ad Sets are having greater impact in with audiences in Tier 1 countries.
Generally advertisers were interested in comparing:
- Groups of Countries based on average spend
- Groups of Apps by Game Categorry
- One Creative vs another Creative
Using seasonality to identify true trends or outliers
"How might we better contextualize current performance data by leveraging broader market trends?"
Taking seasonality trends into account can better help customers understand if their Ad Performance is improving or not. In this case, we compare one data segment over the last 7 days vs the same data segment over the previous 7 days.
It’s common for performance to spike in Ad Performance over the weekends and holidays when people are on their phones more, but seeing more specifically how those seasonal spikes and dips in performance trend week over week put current performance trends into context. Is this week’s spike increasing or decreasing in performance compared to last week?
Connecting Actions and Insights
"Did I do that?"
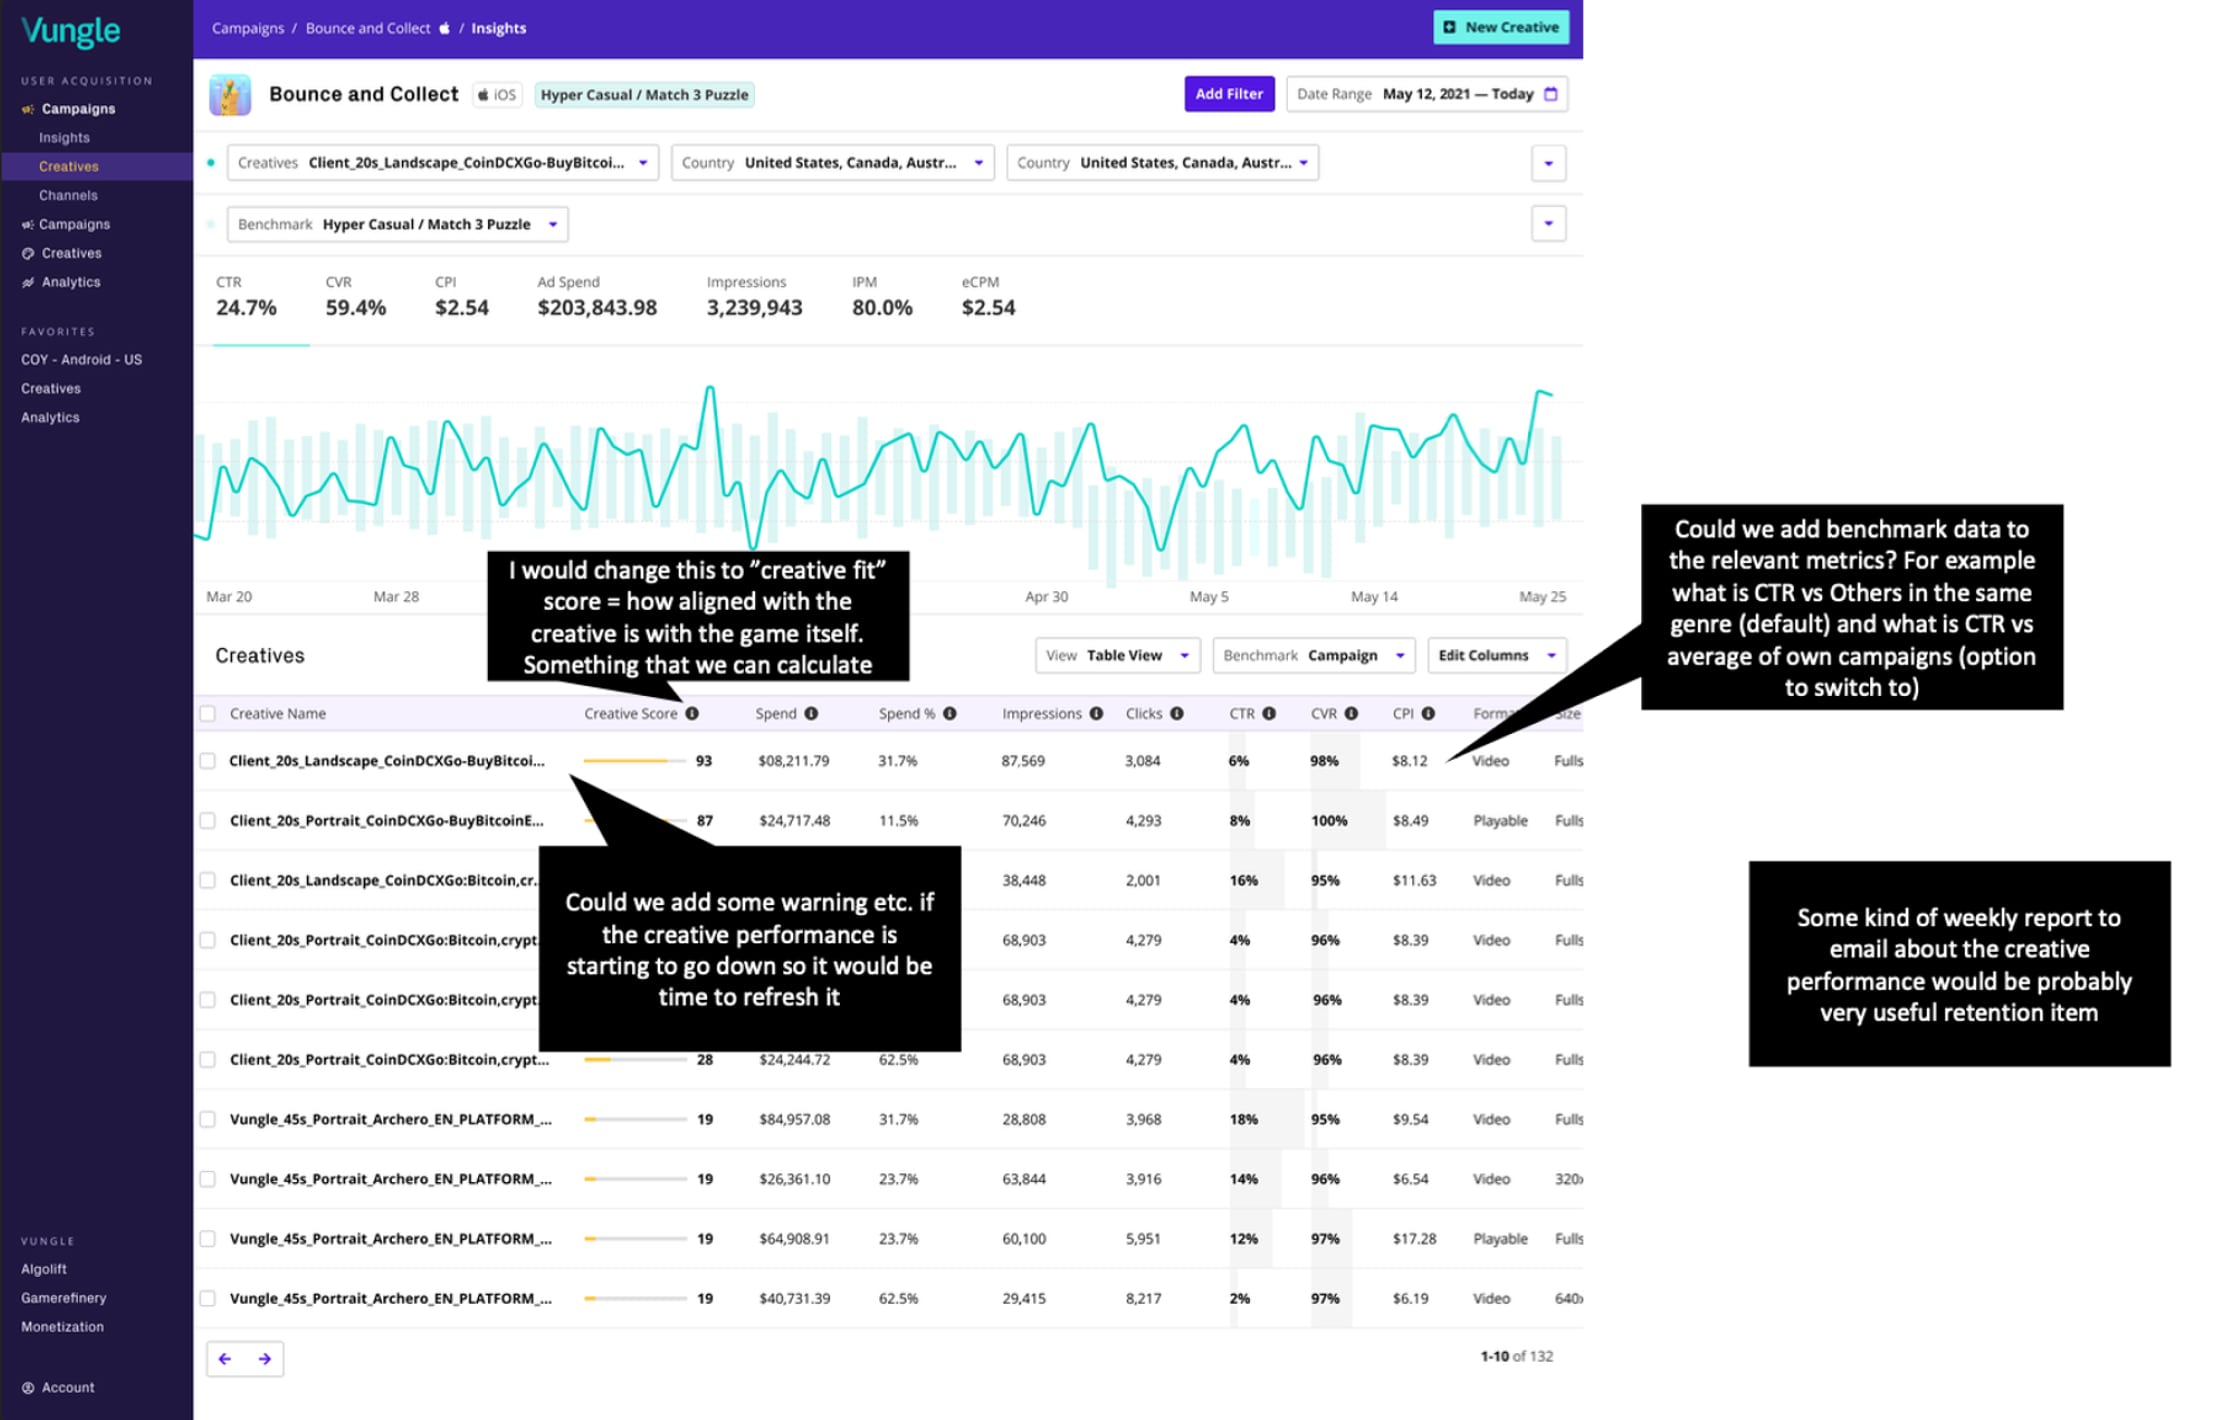
The most frequent mental gap that I picked up from watching Customers and Account Managers make sense of their performance data, especially when looking over date ranges longer than a few weeks, was remembering what actions were applied over the course of a Campaign’s or Creative’s lifespan that lead to certain changes in performance.
Similar to a journal or an event log, showing ad performance data plotted alongside respective actions taken. Given that all changes to Campaigns and Creatives were already being logged the data was there just waiting to be surfaced in a more meaningful way.
Comparing performance vs other games in the same Game Category
"How am I doing compared to similar games?"
Advertisers had specific performance benchmarks they aimed to meet in different countries and app categories. For instance, a $5.00 Cost per Install (CPI) might be seen as costly for an RPG game downloaded in France, but the same CPI for an RPG game in China could be considered a success.
Additionally, when account managers see a drop in performance, they usually check if it's just in one place or happening everywhere. They do this by comparing performance changes across different countries and similar apps.
Presenting these collective benchmarks alongside a customer's own ad performance data could make the data easier to understand at a glance.
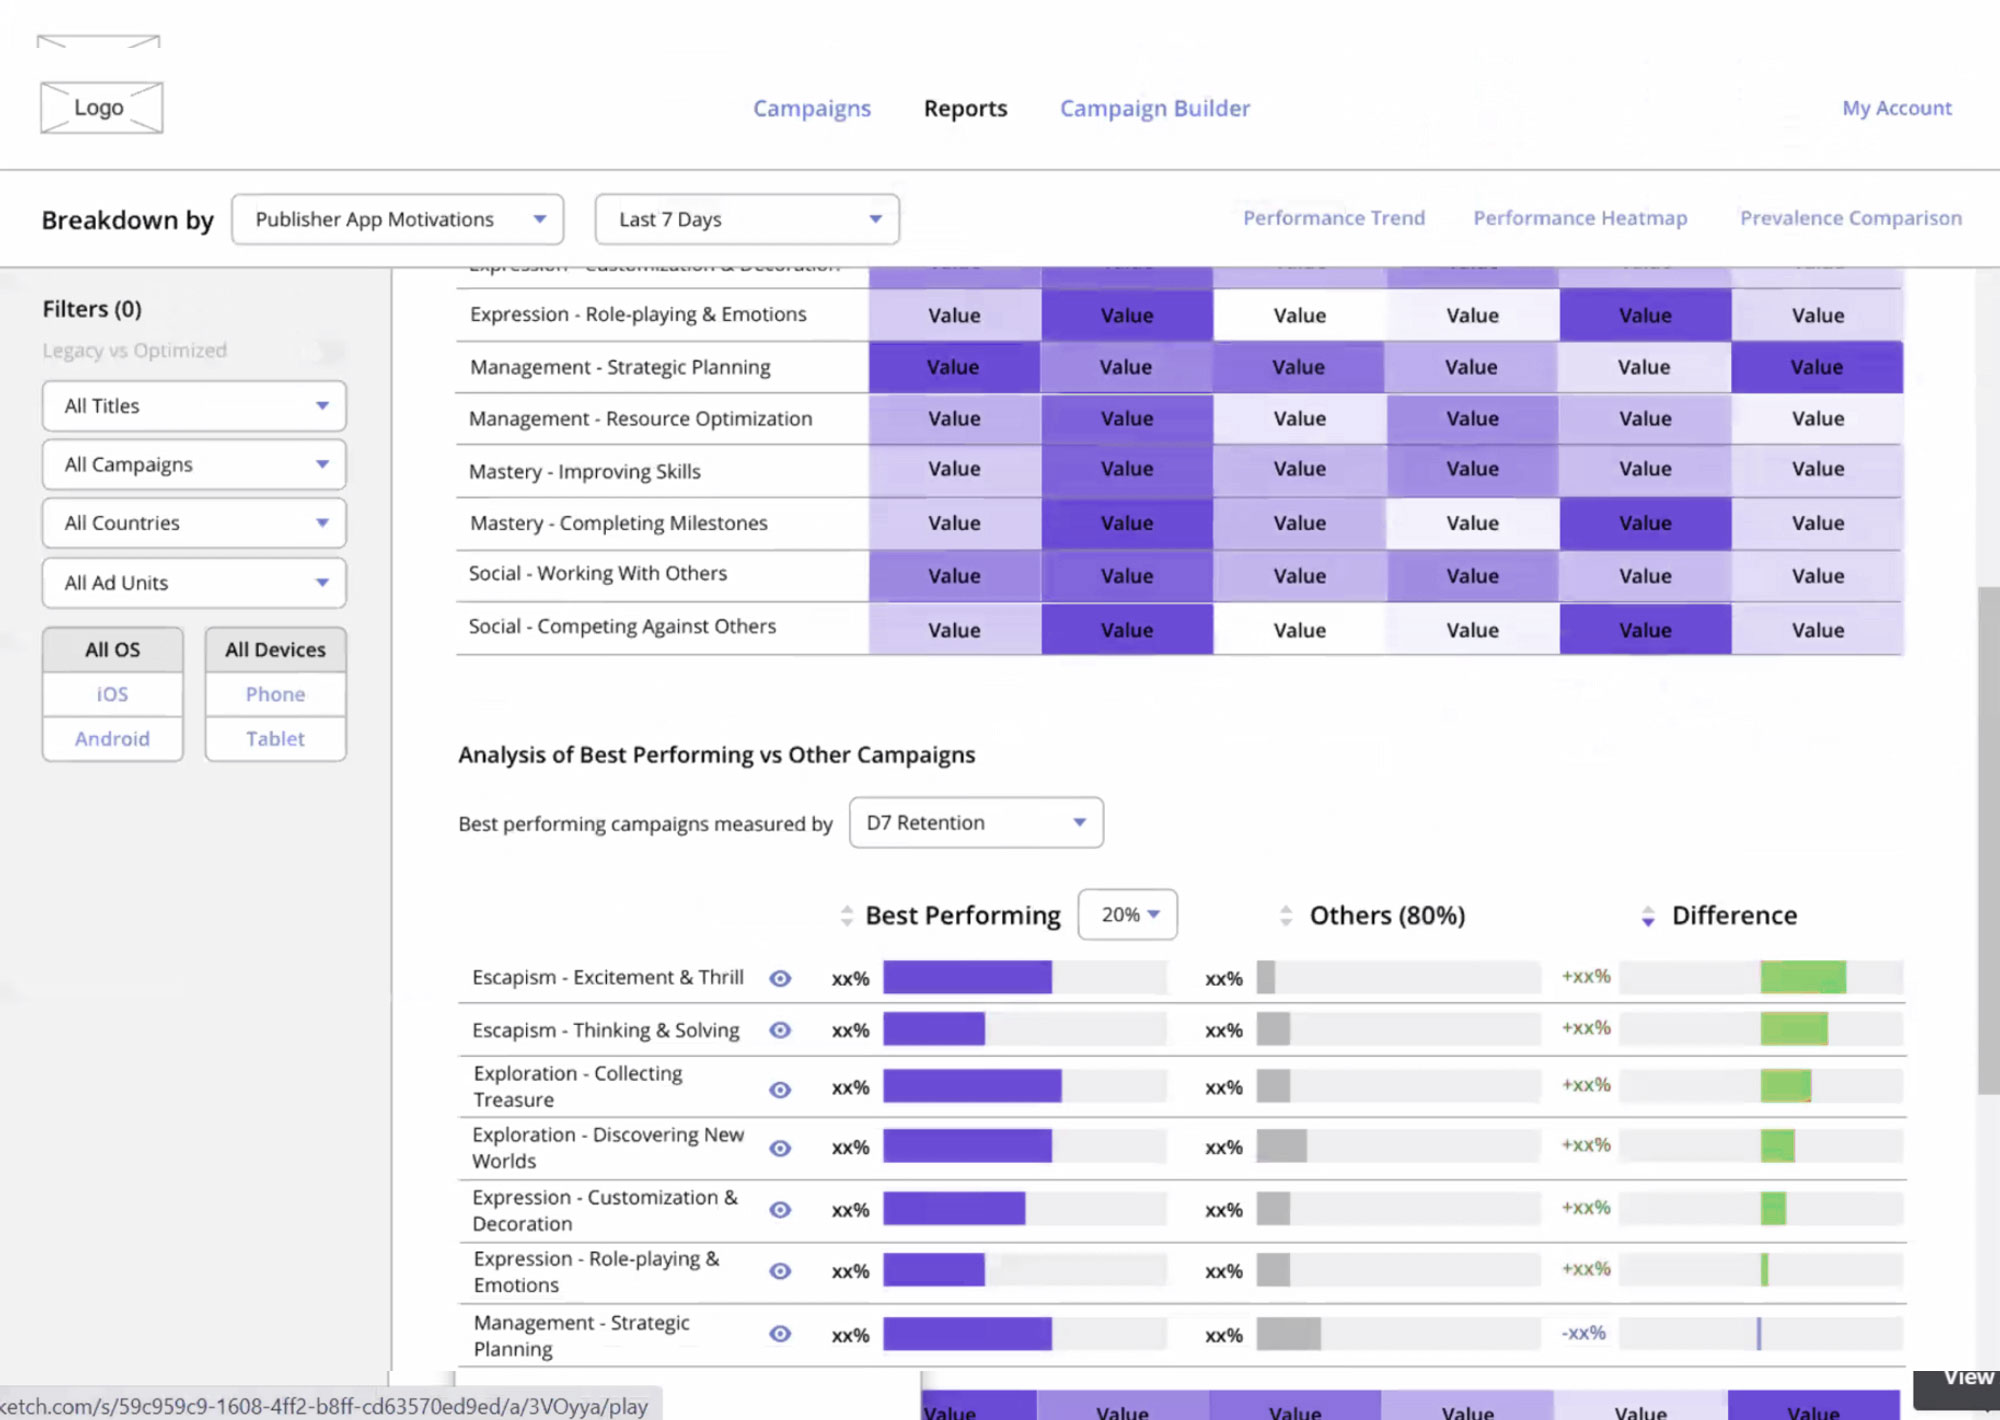
Leveraging metadata to understand patterns of success or improvement
"What creative features do my target audience prefer, based on similar apps in my game category?
Advertisers had specific performance benchmarks they aimed to meet in different countries and app categories. For instance, a $5.00 Cost per Install (CPI) might be seen as costly for an RPG game downloaded in France, but the same CPI for an RPG game in China could be considered a success.
Additionally, when account managers see a drop in performance, they usually check if it's just in one place or happening everywhere. They do this by comparing performance changes across different countries and similar apps.
Presenting these collective benchmarks alongside a customer's own ad performance data could make the data easier to understand at a glance.
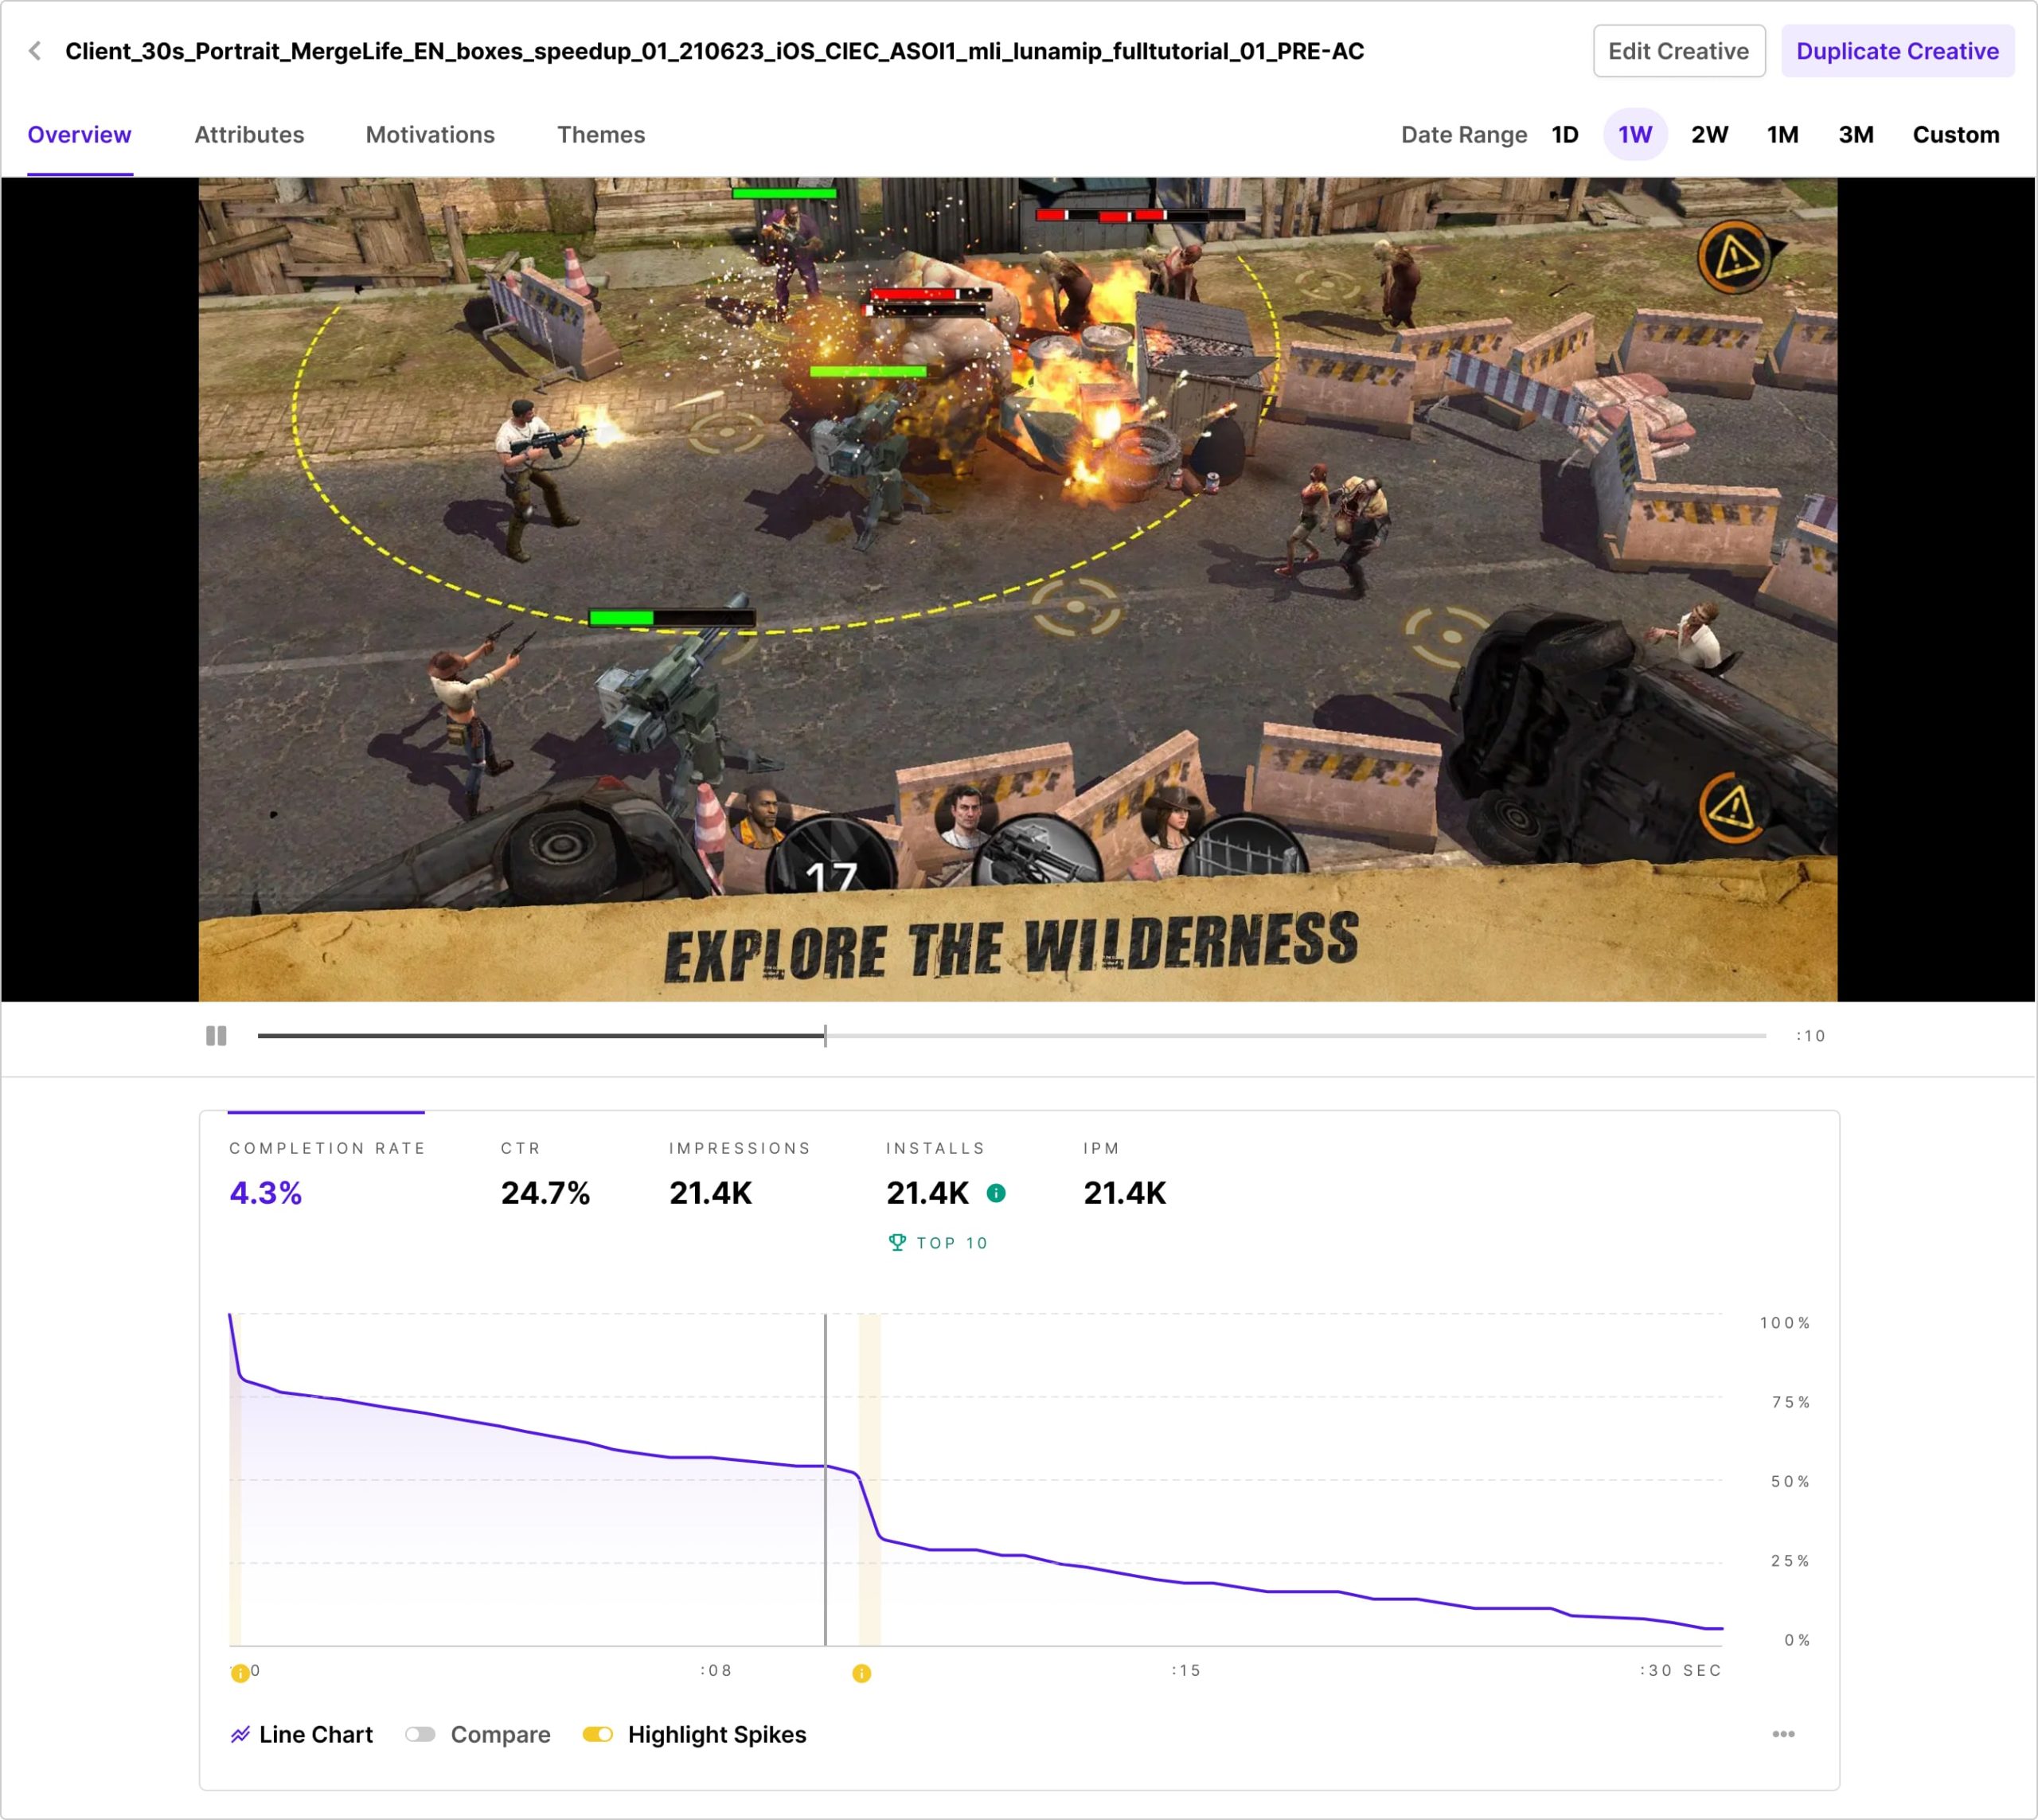
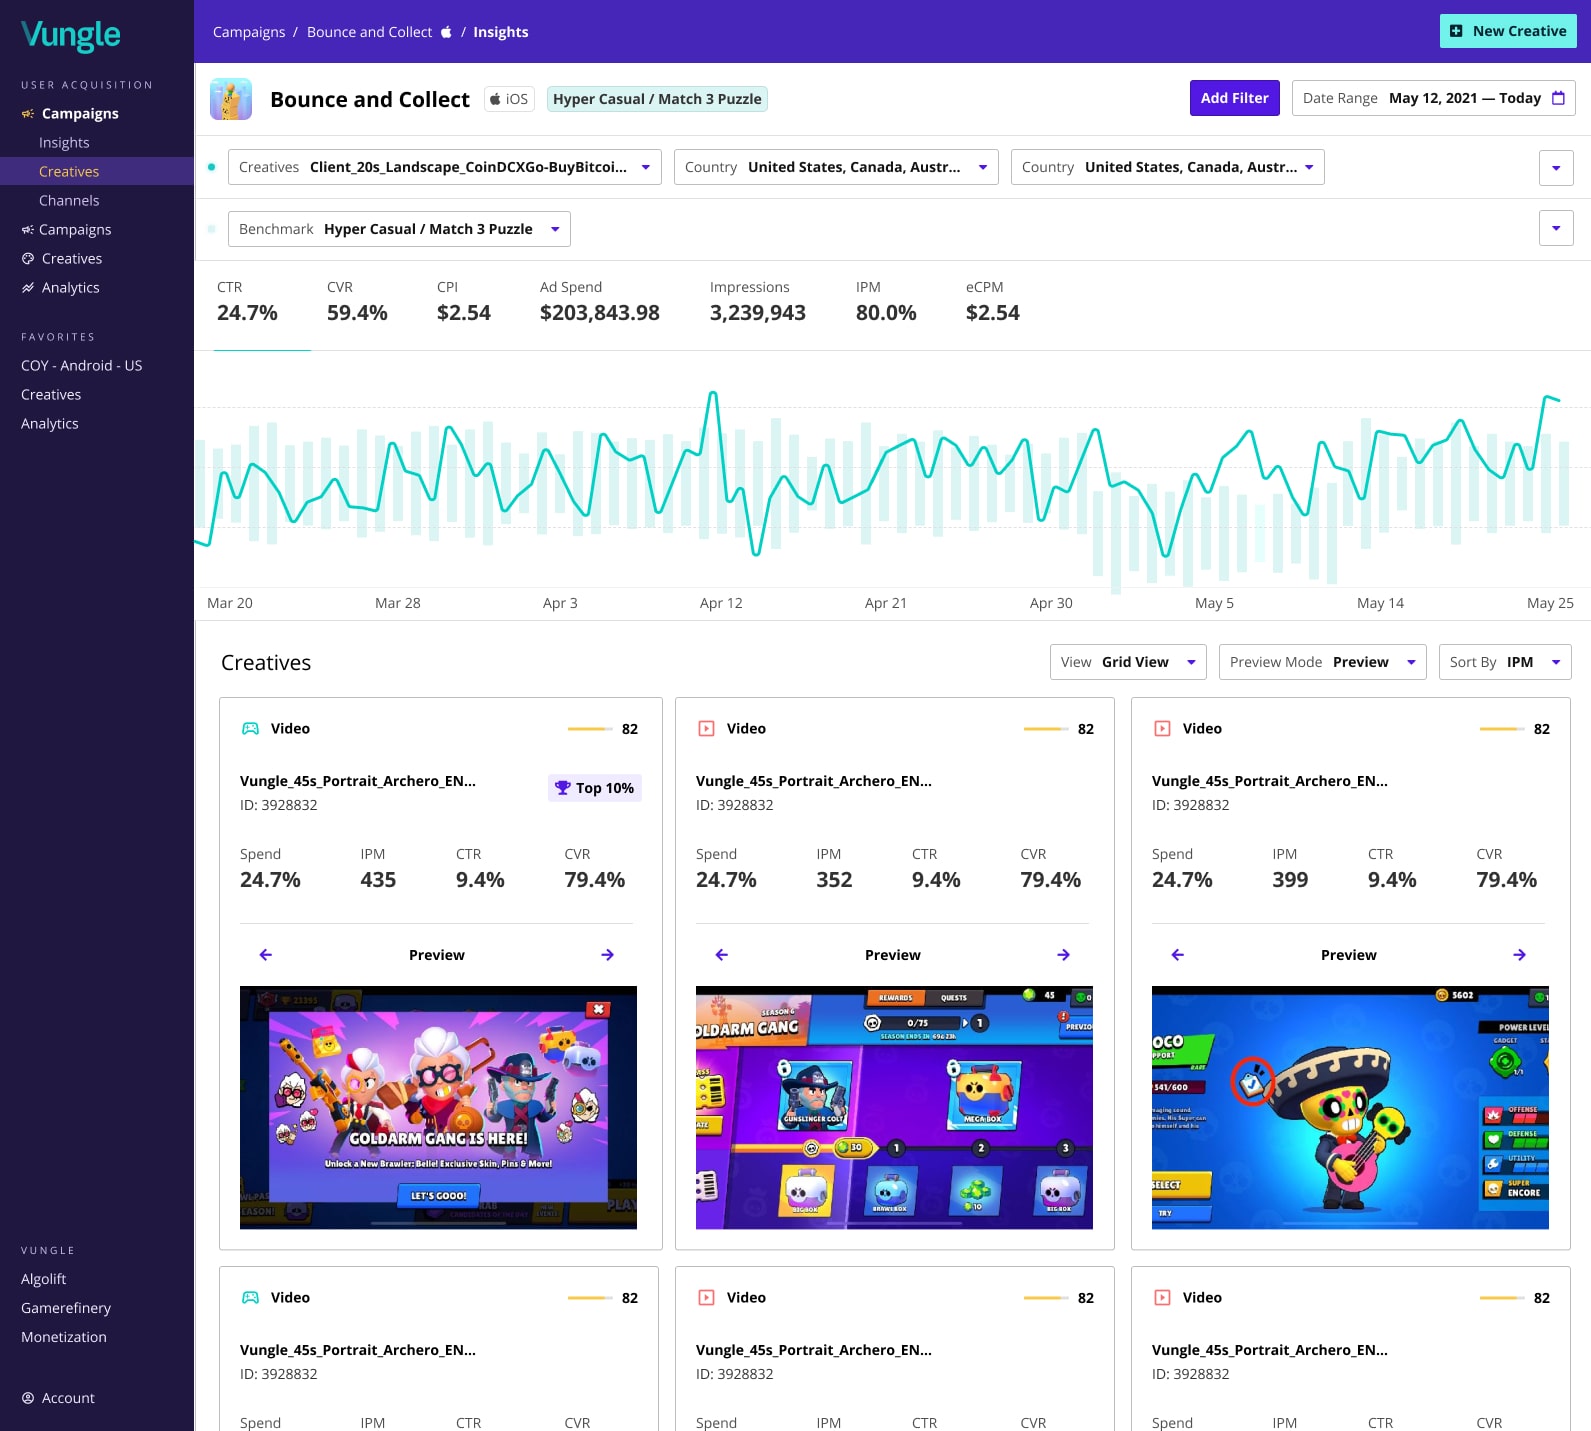
Viewing Creative Performance alongside the Creative itself, could help advertisers pinpoint what messaging, gameplay, etc was critical at driving performance or conversely causing potential leads to churn. In the example above, the dips Completion Rate based on Video Duration highlight areas where a critical mass of users have chosen to skip or close the ad.
Highlighting those sharp spikes and dips in performance could draw advertisers to narrow in on those sections of the Creative and determine what in the Creative could be leading to such critical deltas in performance.
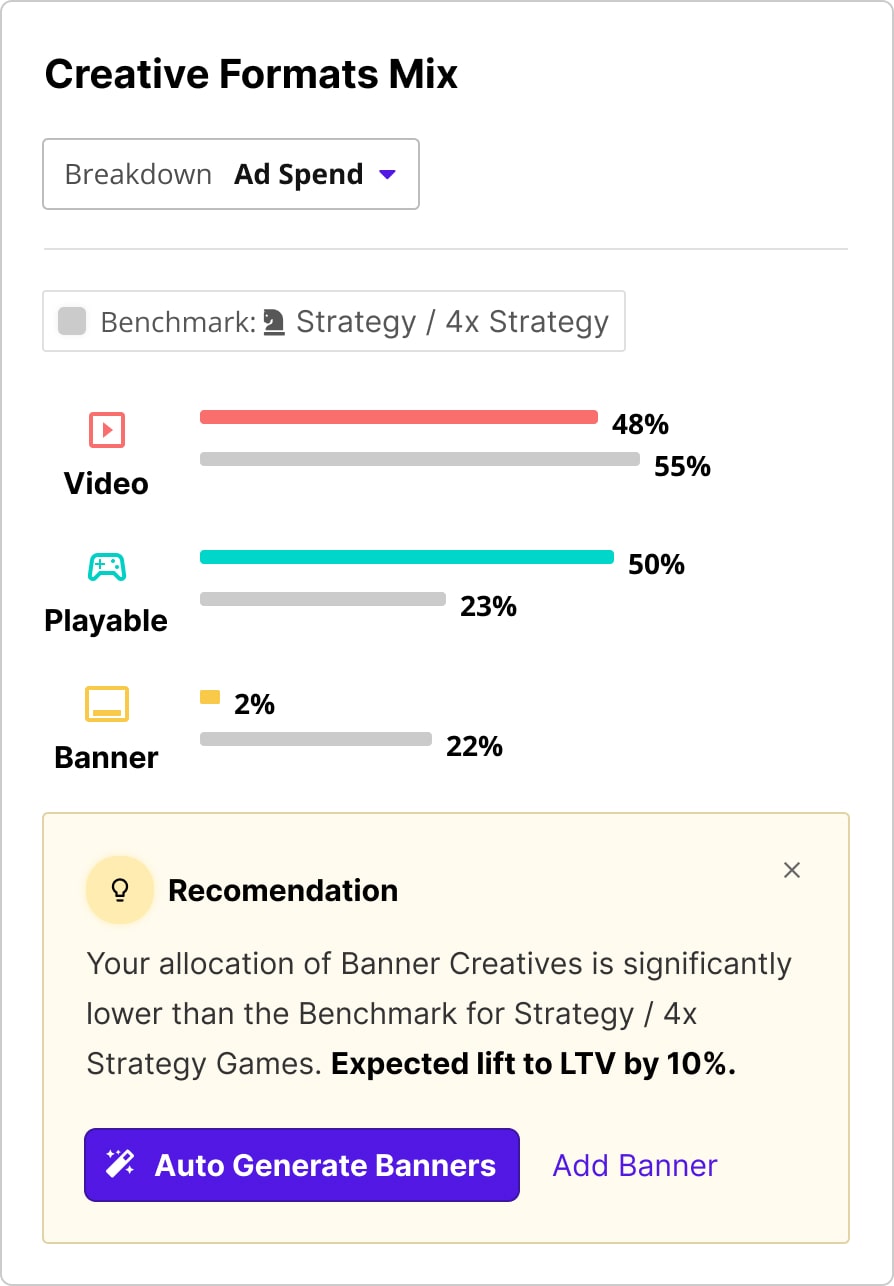
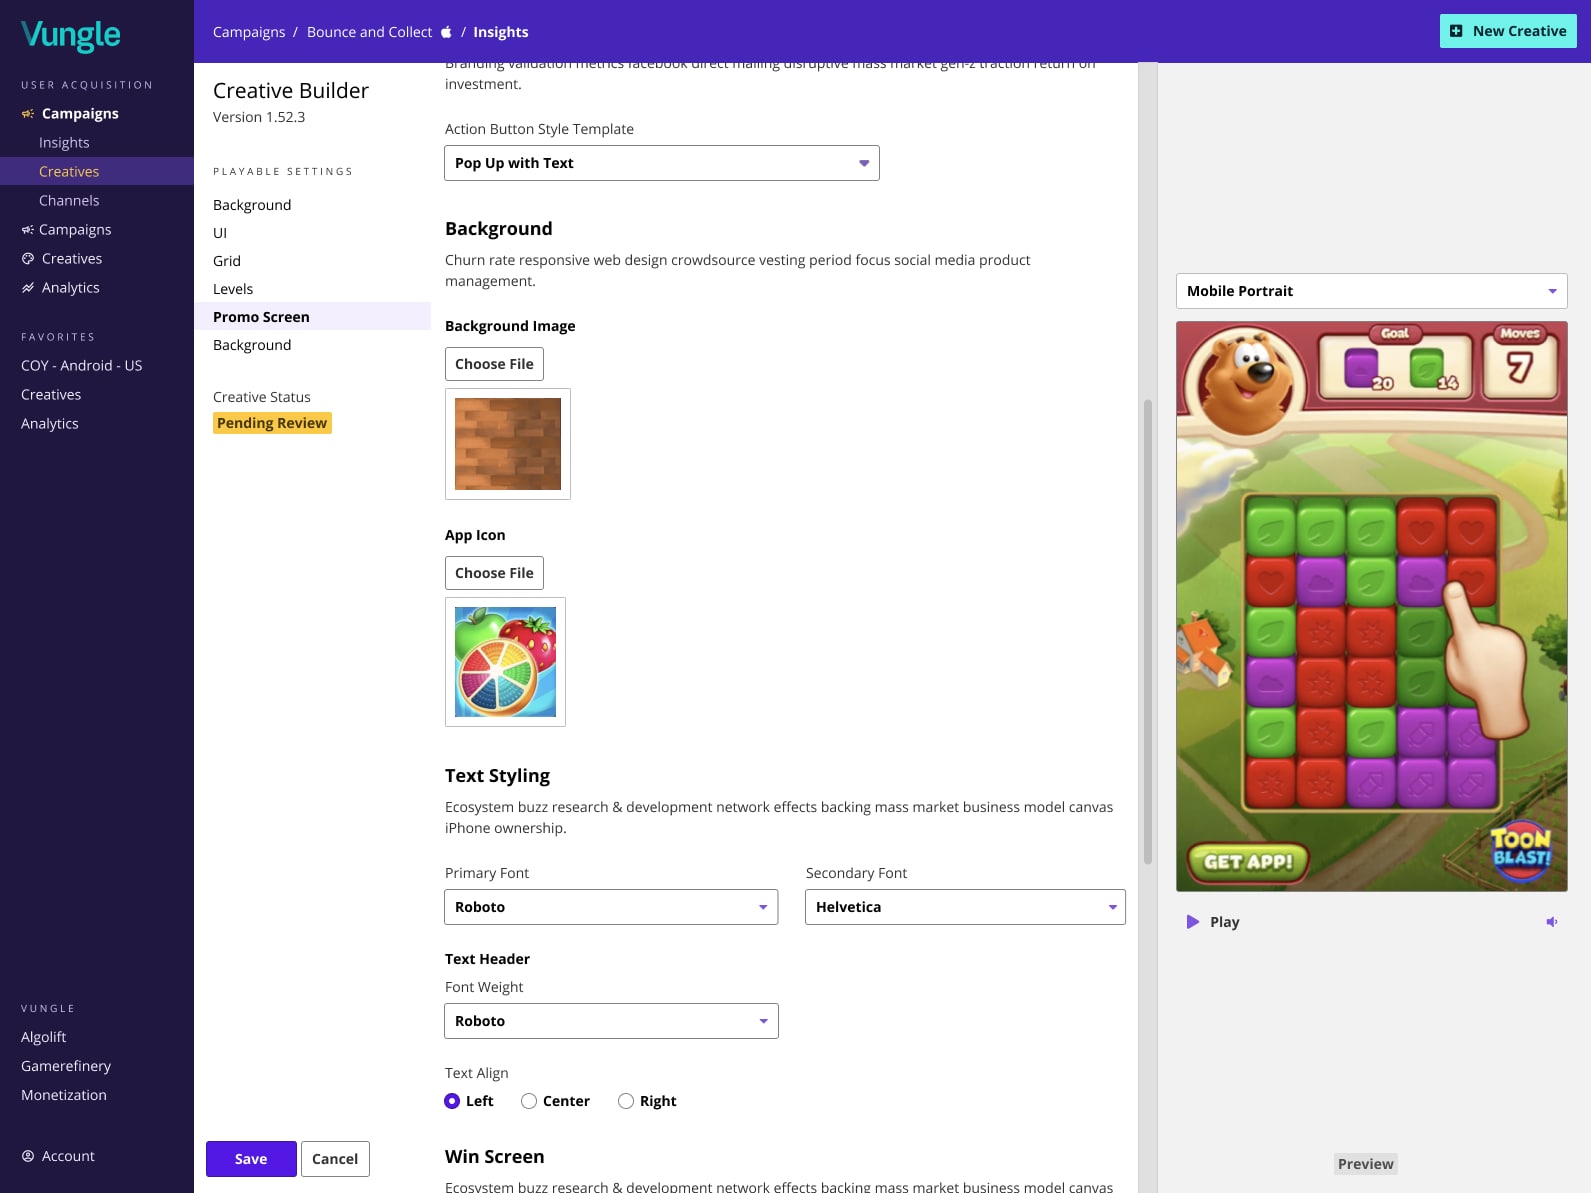
During interviews, account managers and creative strategists noted that advertisers often neglected certain creative formats when onboarding new accounts. This issue could be addressed by calculating the breakdown of creative formats by ad spend compared to recommended benchmarks for similar mobile games. This concept was discussed in a design workshop with our Creative Studio, aligning with the discovery phase for Banner creation.
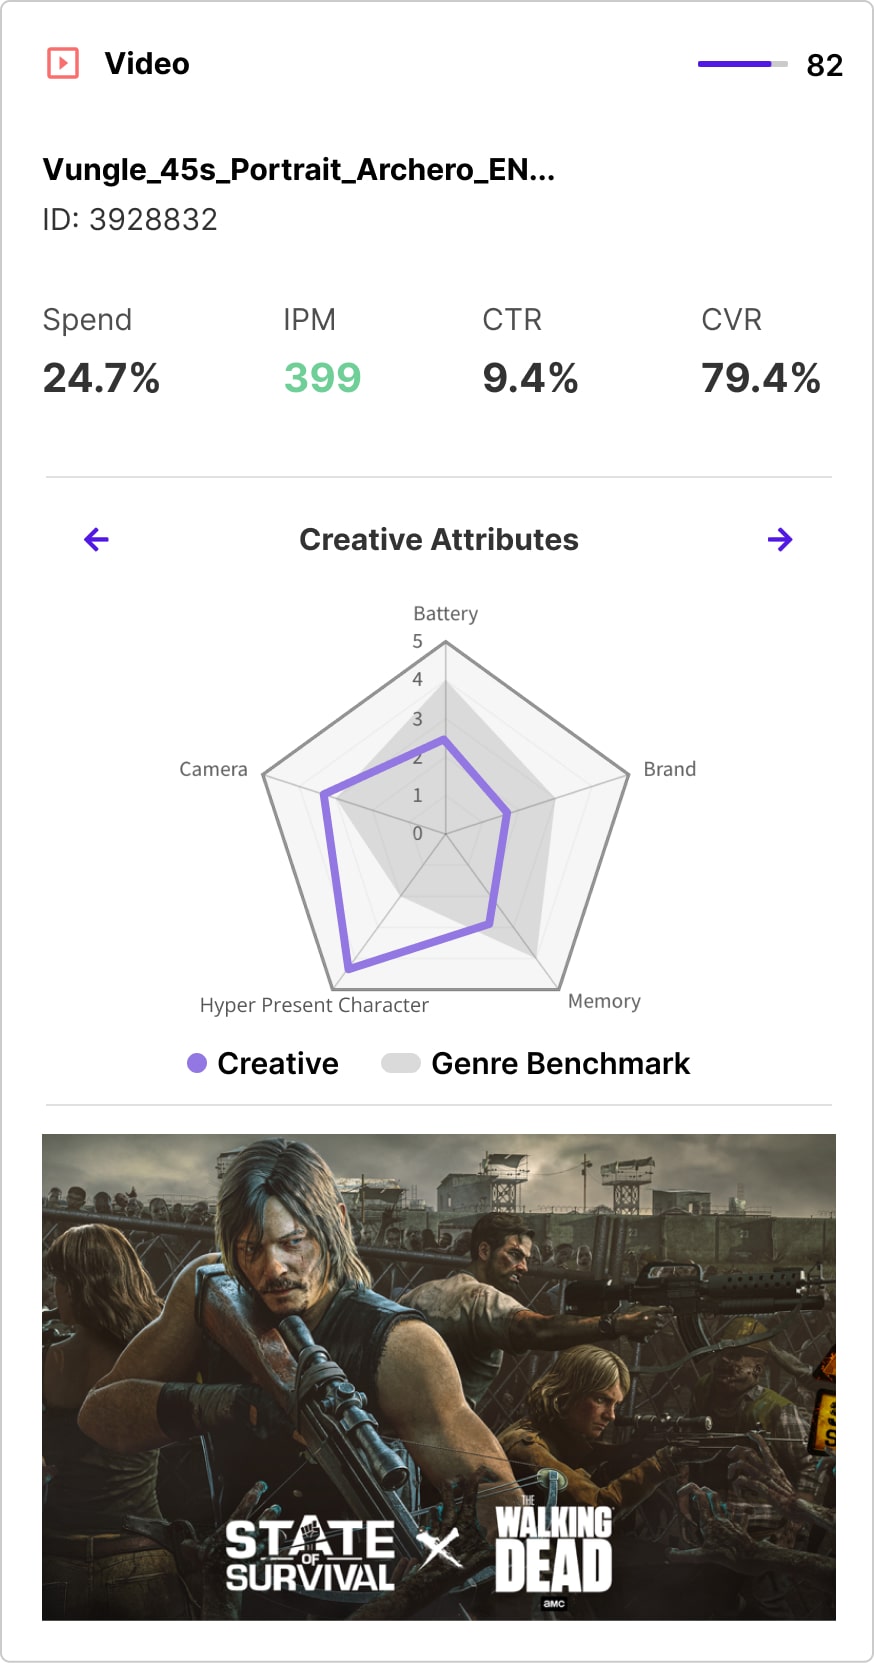
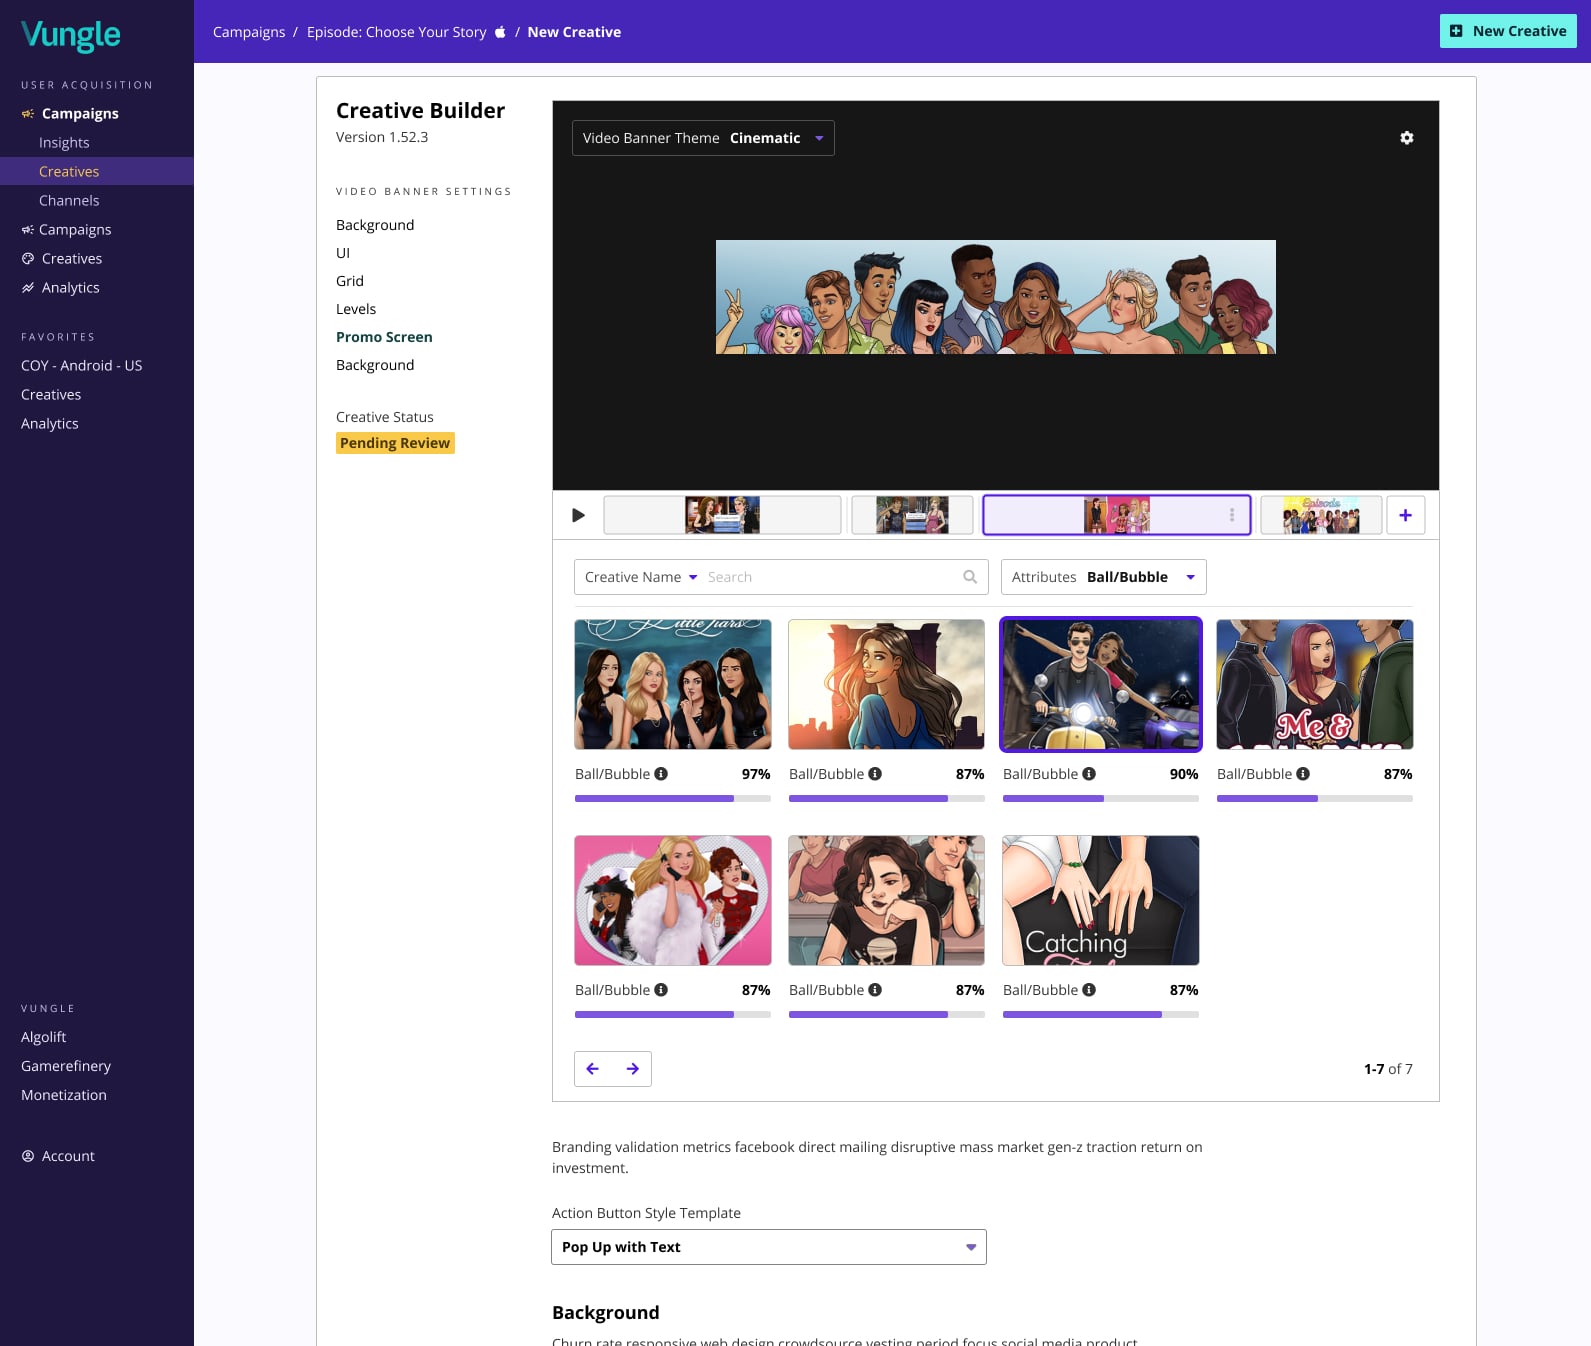
Comparing differences in multiple Banners is easy, but doing so for Videos or Playables at scale is challenging. Gamerefinery’s Visual Mind product used computer vision to analyze Video frames and compile ad properties based on mobile game attributes. I created various data visualization concepts, and the radar chart proved most effective for explaining differences between creatives. It compares attributes of two creatives: one being the target and another the average of top 10% in a Game Category. This comparison helps identify significant deviations and whether they benefit the Campaign, aiding in the discovery of new successful Creative ideas.
PART THREE: EXECUTION
Making the vision a reality
The reception of the vision demo was well received, and after the exercise I worked with the Vungle Ads, Gamerefinery, Algolift, and Tresensa engineering teams to map out scope and weigh out LOE vs business opportunity.
A few months later, in October, another consolidation was announced, except this time it was a merger between Vungle and another Ad Network / DSP called Liftoff. With the merger came a change in leadership and a revised mission to double down on existing products and customer needs. This meant being more lean about how we approached delivering a unified customer experience.
Over the next 18 months we were able to deliver the following:
Notable outcomes from the Gateway project (more detail coming soon)
- Gamerefinery creative intelligence is now an essential part of the video ad discovery process for creative strategists at Creative Studio.
- Customer acquisition and cross promotion Initiatives helped build business to $10MM Exit ARR for SaaS revenue by end of 2021.
- Standardized visual representation and branding rolled out across all customer facing products
- Development and partial adoption of a unified, component based design system
- Algolift ML based bidding integrated into Vungle dashboard and scaled to represent 70% of Ads business
- Improvements to Vungle Ads reporting experience lead to an overall increase in session duration when a page with reporting was visited.
For more information on outcomes and execution of this project, please contact me for additional information: brandon@bchau.com
©2020 Brandon Chau — bchau.com